Risk disclaimer: 76% of retail investor accounts lose money when trading CFDs and Spreadbets with this provider. You should consider whether you understand how CFDs and Spreadbets work and whether you can afford to take the high risk of losing your money.
GBPNZD analysis | The market rallies 600 pips
BY Janne Muta
|October 24, 2023GBPNZD analysis - The GBPNZD currency pair has shown strong bullish momentum, exceeding key resistance levels. Technical indicators such as moving averages and the stochastic oscillator support this bullish outlook. The next resistance area is around the 61.8% Fibonacci retracement level at 2.1096. However, the market is also showing signs of being overbought, suggesting caution. Both upward and downward scenarios are considered, with key support and resistance levels identified for each.
UK Manufacturing Sector Performance
The S&P Global/CIPS UK Manufacturing PMI for October 2023 rose to 45.2, up from 44.3 in September, surpassing market expectations of 44.7. However, this still indicated an eighth consecutive month of declining output, the longest such period since 2008/09.
UK Services Sector Performance
In contrast, the UK Services PMI slightly declined to 49.2, its lowest level in nine months and below the anticipated 49.3. Factors affecting this decline included low consumer confidence, elevated borrowing costs, and weak real estate demand. The technology services sub-sector was an exception, showing resilience. Input price inflation in services slowed, but output charges rose sharply, in an effort to offset broader inflationary pressures.
Future Growth Expectations in the UK
Both sectors showed a sharp fall in future growth expectations. The data points to continuing challenges in both the manufacturing and services sectors, with subdued performance and pessimistic outlooks for growth.
The sharp fall in future growth expectations in both the manufacturing and services sectors is a significant cause for concern, indicative of a pessimistic business climate. Such expectations often serve as a leading indicator for actual economic performance, suggesting that both sectors anticipate further headwinds.
New Zealand's Manufacturing Sector
In comparison, New Zealand's Manufacturing Index dropped to 45.3 in September 2023, marking its lowest level since August 2021 and a seventh consecutive month of contraction. Key factors include falling sales, election uncertainty, and rising costs. New orders, employment, and deliveries worsened, while production slightly improved. Finished stocks remained positive.
The key risk events for GBPNZD are
- BoE Consumer Credit
- ANZ Business Confidence
- RBNZ Financial Stability Report
- Employment Change
- Unemployment Rate
- BoE Interest Rate Decision
Read the full GBPNZD analysis report below.
GBPNZD analysis
Weekly GBPNZD analysis
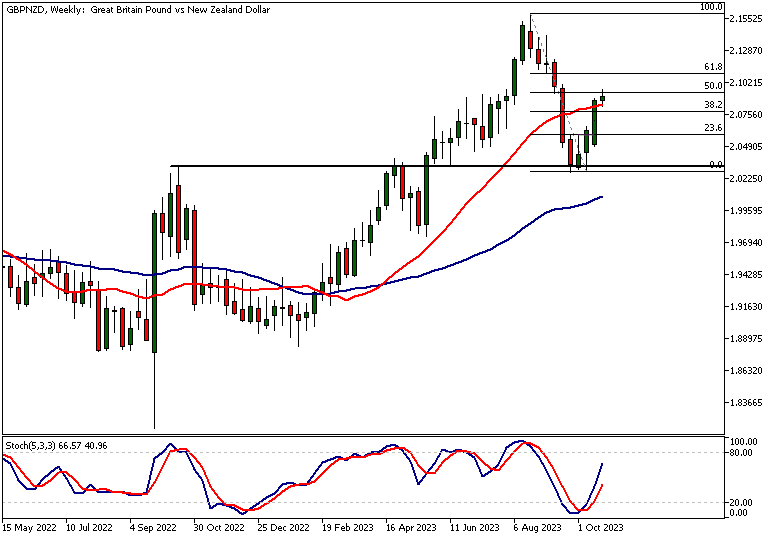
GBPNZD has rallied over 3% since we highlighted the pair moving to a key support area in our report. We noted at the time that "if bulls manage to push GBPNZD higher from this point, a move towards 2.0842 becomes plausible". Now the market has rallied strongly and even exceeded the 2.0842 level.
Indicator-Oriented Analysis of GBPNZD
Indicator-oriented GBPNZD analysis suggests the market is indeed bullish. The moving averages are both pointing higher and the fast SMA(20) is above the SMA(50). This bullish indication is supported by the GBPNZD rallying strongly which is reflected in the stochastic oscillator pointing higher.
Fibonacci Retracement and SMA(50)
The market has rallied to the 50% Fibonacci retracement level at 2.0939 and it has exceeded the SMA(50) once again. Note how the candles for the last two weeks have been bullish wide-range candles. Such candles have a better-than-average predictive value when it comes to the continuation of upside volatility.
Significance of Bullish Momentum Candles
In other words, while there are no guarantees that the market will move higher after a bullish momentum candle, a strong move higher indicates that another push to the upside is more probable than a move lower.
Potential Profit-Taking Area
Our GBPNZD analysis has identified the next resistance area to focus on is around the 61.8% Fibonacci retracement level, 2.1096. This is a potential area for profit-taking and could therefore slow the rally down. If the momentum reverses, we might see the market trading down to 2.0750 or so.
Daily GBPNZD technical analysis
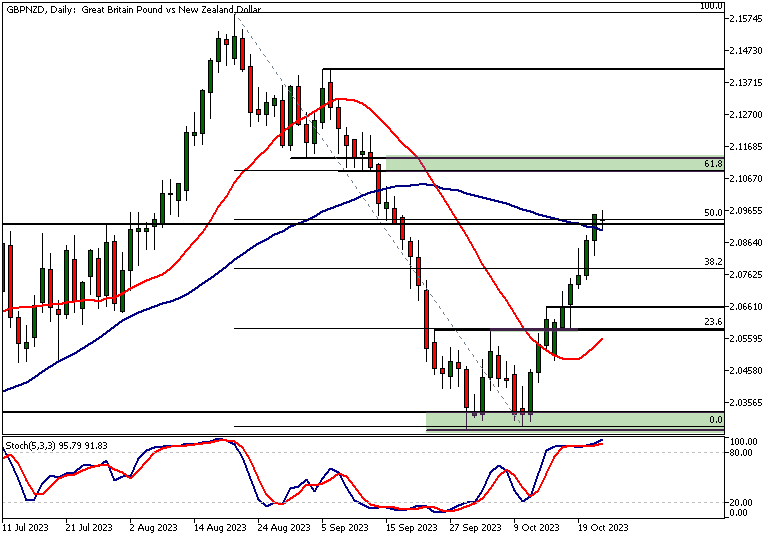
The daily chart shows GBPNZD rallying higher for nine days in a row. This has moved the stochastic oscillator into the overbought zone already seven (trading) days ago. This goes to show how price action itself is the key factor here and technical indicators and their indications are subject to it. Always pay more attention to what the price is telling you than what the indications given by indicators are.
Confluence of Technical Levels in the Daily Timeframe
The 50% Fibonacci retracement level the market rallied to is somewhat closely aligned with the SMA(50) in the daily timeframe. Note how the SMA(20) we referred to in the weekly GBPNZD analysis aligns approximately with this same price level. The level coincides also with a historical market structure level (2.0920) and a measured move (based on the earlier range). Both of these factors add to the validity of this confluence area.
Statistical Likelihood of Market Direction
Statistically, as discussed in the weekly GBPNZD analysis, the market should now be more likely to move higher (based on the strong momentum seen lately) but as we don't know for sure it's prudent to consider both scenarios (market moving higher and market moving lower).
Bullish Scenario
First the bullish alternative: If the rally continues, look for a move to the 2.1085 - 2.1130 range. This confluence zone contains the 61.8% Fibonacci retracement level and two market structure levels. Note that this area could invite profit-taking.
Bearish Scenario and Support Levels
And the bearish alternative: If the confluence area around the 50% retracement level turns out to be the area that turns the price lower, look for a move to the 2.0750 region. The nearest support area below 2.0750 is at 2.0583 - 2.0660.
4h GBPNZD technical analysis
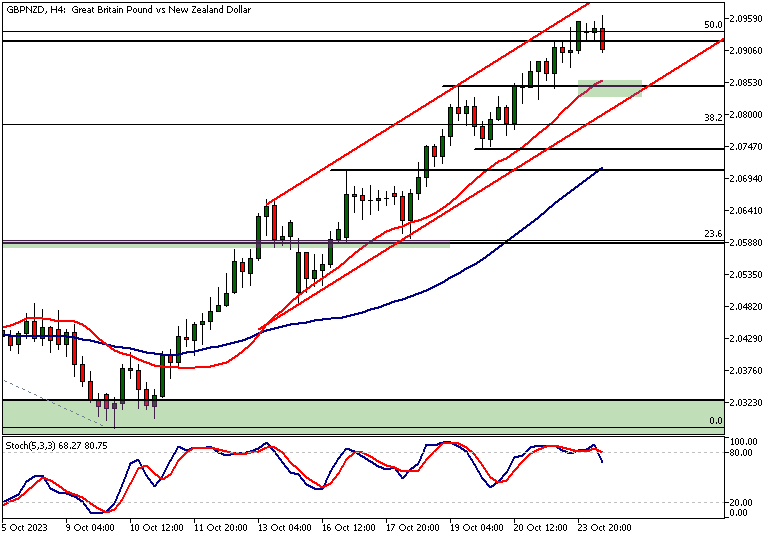
In the 4h timeframe, the GBPNZD analysis shows, the market trades higher in a bullish trend channel. Both moving averages are bullish and the stochastic oscillator is in the overbought territory. Therefore, the market in this timeframe is quite bullish. The nearest key support level is at 2.0846 and roughly coincides with the SMA(20), creating a narrow confluence area.
Key Technical Levels and Potential Market Scenarios
The next technical level below this we should mention is the bull channel low at 2.0800. If these levels do not attract buyers, a move to the 2.0743 support level looks more likely. If the rally continues, a move to the 2.1085 - 2.1130 range could be likely. See the daily section of this GBPNZD analysis report for details.
GBP and NZD currency strength analysis
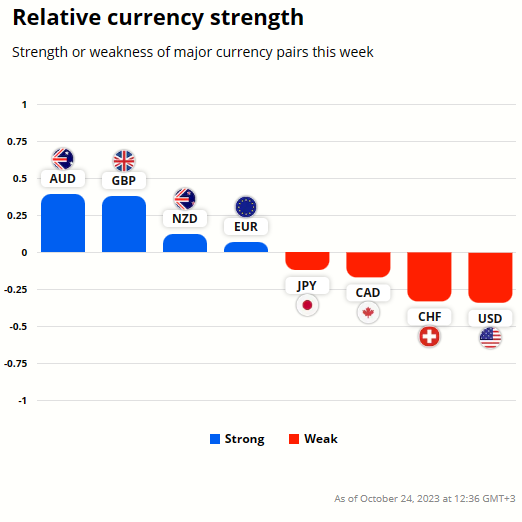
GBP has been stronger than NZD this week but only slightly. AUD is the strongest while USD is the weakest.
To gain better understanding on the potential future price moves in these currencies refer to the GBPNZD analysis above.
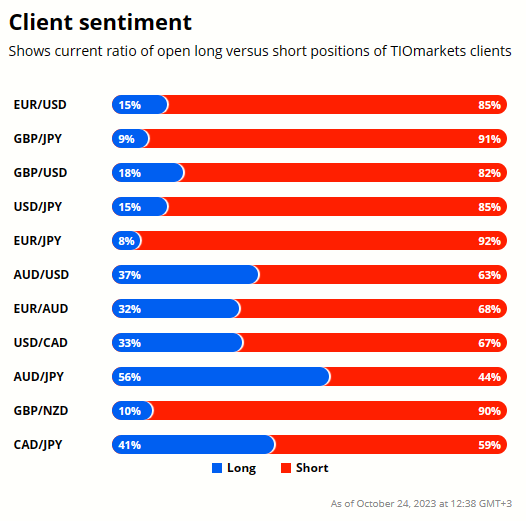
Client sentiment analysis
TIOmarkets clients are very bearish on GBPNZD with 90% of clients holding short positions and only 10% long in the market.
Please remember that the retail trader client sentiment is a contrarian indicator as most of the retail traders are on average betting against the market trends. This is why, experienced traders tend to trade against the retail client sentiment. You can follow the TIOmarkets client sentiment live on our Forex dashboard.
GBPNZD macroeconomic analysis
In the UK, the manufacturing sector showed a slight improvement with a PMI of 45.2 in October 2023, though it marked the eighth consecutive month of decline. Conversely, the services sector registered a decline to 49.2.
In both economies, there's a marked fall in future growth expectations, indicative of a broader pessimistic business outlook. This is particularly troubling as these expectations often serve as leading indicators for actual economic performance.
Monetary Policy in the UK
The Bank of England has maintained a policy interest rate of 5.25%, representing a pause in its tightening cycle. This pause comes after an unprecedented 515 basis points hike and reflects a more cautious approach in light of mixed inflation and labour data. The central bank expects CPI inflation to decline significantly in the near term, despite external pressures such as rising oil prices.
New Zealand Economic Landscape
New Zealand's manufacturing sector dipped to a PMI of 45.3 in September 2023, its lowest since August 2021, indicating a seventh straight month of contraction. While the UK's challenges stem from a lack of new orders and customer destocking, New Zealand grapples with falling sales and rising costs.
The central bank also highlighted near-term risks, including higher oil prices, and medium-term concerns of weaker global demand, particularly from China, which could impact export revenues.
Monetary Policy in New Zealand
The Reserve Bank of New Zealand has kept its OCR at 5.5%, representing a pause in its tightening cycle. New Zealand's central bank has opted for this approach to restrict spending and reduce cost pressures, following a significant 525 basis points hike since October 2021. The bank is dealing with inflation levels above their target range and faces the added vulnerability of weaker global demand, particularly from China.
Comparative Summary
In summary, both the UK and New Zealand are experiencing contractions in manufacturing and services sectors, albeit for different reasons. Monetary policies in both nations are similarly restrictive, aimed at curbing inflation, yet the economic contexts within which these policies operate are distinct, with New Zealand facing additional challenges of potential external demand shocks from China.
The key takeaways from this GBPNZD analysis report
- The GBPNZD pair has shown strong bullish momentum, recently exceeding key resistance at 2.0842. Technical indicators such as moving averages and the stochastic oscillator support a bullish outlook. The next resistance is at the 61.8% Fibonacci retracement level, 2.1096.
- UK's Manufacturing PMI for October 2023 rose to 45.2, surpassing market expectations but still indicating a decline. Similarly, the Services PMI dropped to 49.2. These numbers suggest a mixed yet overall negative economic outlook, affecting the GBP strength.
- New Zealand's Manufacturing Index marked a low at 45.3 in September 2023. Key issues include falling sales and rising costs. This negative trend in manufacturing indicates that the NZD could be facing challenges ahead, thus impacting the GBPNZD pair.
- Bank of England maintains a policy rate of 5.25%, pausing its tightening cycle. The Reserve Bank of New Zealand keeps its OCR at 5.5%. These monetary policies can impact the GBPNZD pair, especially if any change in rates occurs.
- GBPNZD daily chart shows nine consecutive bullish days, moving the stochastic oscillator into the overbought zone. While this suggests strong momentum, traders should exercise caution as technical indicators show signs of being overbought.
- Retail client sentiment for GBPNZD is bearish, with 90% holding short positions. This sentiment often acts as a contrarian indicator. Experienced traders might consider this when making their trading decisions on the GBPNZD currency pair.

The next main risk events
- USD - Flash Manufacturing PMI
- USD - Flash Services PMI
- USD - Richmond Manufacturing Index
- AUD - CPI
- AUD - Trimmed Mean CPI
- EUR - German ifo Business Climate
- CAD - BOC Monetary Policy Report
- CAD - BOC Rate Statement
- CAD - Overnight Rate
- USD - New Home Sales
- CAD - BOC Press Conference
- EUR - ECB President Lagarde Speaks
- USD - Fed Chair Powell Speaks
- EUR - Main Refinancing Rate
- EUR - Monetary Policy Statement
- USD - Advance GDP
- USD - Unemployment Claims
- USD - Advance GDP Price Index
- USD - Core Durable Goods Orders
- USD - Durable Goods Orders
- EUR - ECB Press Conference
- USD - FOMC Member Waller Speaks
- USD - Pending Home Sales
- JPY - Tokyo Core CPI
- NZD - RBNZ Statement of Intent
- USD - Core PCE Price Index
- USD - Revised UoM Consumer Sentiment
For more information and details see the TIOmarkets economic calendar.
While research has been undertaken to compile the above content, it remains an informational and educational piece only. None of the content provided constitutes any form of investment advice.
Tio Markets UK Limited is a company registered in England and Wales under company number 06592025 and is authorised and regulated by the Financial Conduct Authority FRN: 488900
Risk warning: CFDs are complex instruments and come with a high risk of losing money rapidly due to leverage. 82% of retail investor accounts lose money when trading CFDs with this provider. You should consider whether you understand how CFDs work and whether you can afford to take the high risk of losing your money. Professional clients can lose more than they deposit. All trading involves risk.
DISCLAIMER: Tio Markets offers an exclusively execution-only service. The views expressed are for information purposes only. None of the content provided constitutes any form of investment advice. The comments are made available purely for educational and marketing purposes and do NOT constitute advice or investment recommendation (and should not be considered as such) and do not in any way constitute an invitation to acquire any financial instrument or product. TIOmarkets and its affiliates and consultants are not liable for any damages that may be caused by individual comments or statements by TIOmarkets analysis and assumes no liability with respect to the completeness and correctness of the content presented. The investor is solely responsible for the risk of his/her investment decisions. The analyses and comments presented do not include any consideration of your personal investment objectives, financial circumstances, or needs. The content has not been prepared in accordance with any legal requirements for financial analysis and must, therefore, be viewed by the reader as marketing information. TIOmarkets prohibits duplication or publication without explicit approval.

Janne Muta holds an M.Sc in finance and has over 20 years experience in analysing and trading the financial markets.
