Risk disclaimer: 76% of retail investor accounts lose money when trading CFDs and Spreadbets with this provider. You should consider whether you understand how CFDs and Spreadbets work and whether you can afford to take the high risk of losing your money.
NZDUSD technical analysis | Higher volatility due to key risk events today?
BY Janne Muta
|September 14, 2023NZDUSD technical analysis reveals how on the weekly chart, the pair appears oversold according to the Stochastic Oscillator. However, a bearish 'shooting star candlestick and a cluster of resistance levels between 0.5984 and 0.6050 indicate that bulls are not yet in control.
The daily chart corroborates this view but shows also a developing bullish wedge formation. A strong breakout could push the market substantially higher, while failure to do so could break the recent lows.
External factors such as the release of US Core PPI data and the ECB rate decision are also likely to contribute to volatility in NZDUSD. Overall, NZDUSD technical analysis reveals that while indicators suggest some bullish momentum, considerable uncertainties remain, making it imperative that traders follow our multi-timeframe analysis and the price action in the pair as it evolves.
The risk events impacting this currency pair today are the ECB Main refinancing rate decision, the ECB press conference, US PPI and Core PPI and US Retail Sales numbers.
The key takeaways:
- The weekly chart of NZDUSD indicates an oversold condition with a Stochastic Oscillator reading of 5.3.3, just breaching the 20-point threshold. A crossover above this level could serve as a buy signal, especially if confirmed by higher lows on lower timeframes like the daily and 4-hour charts.
- In terms of price channel analysis, NZDUSD has been trading at the lower end of a descending channel over the past three to four weeks. This suggests limited downside movement and potential for a reversal, although the resistance levels between 0.5984 and 0.6050 need to be closely monitored.
- A shooting star candle formation appeared on the weekly chart two weeks ago, signalling a lack of bullish control. The high of this candle lies within the key resistance area of 0.5984 - 0.6050, indicating a rally failure and a possible continuation of the downtrend.
- The daily chart shows a bullish wedge formation near the bear channel low. A strong breakout above the higher end of the formation could take the market to approximately 0.6105, provided the resistance between 0.5984 and 0.6050 is decisively cleared.
- If NZDUSD fails to break out from the bullish wedge on the daily chart, a decisive break below 0.5859 could lead the pair to the 0.5740 – 0.5820 range. Both the daily SMA(50) and SMA(20) are pointing lower, corroborating the bearish outlook.
- The 4-hour chart indicates an overbought condition with the Stochastic Oscillator. Additionally, the market has failed to maintain above the 50% Fibonacci retracement level, setting a bearish bias for intraday trading. NZDUSD is expected to be more volatile today due to the release of US Core PPI data and the ECB rate decision.
Read the full NZDUSD technical analysis report below.
NZDUSD technical analysis
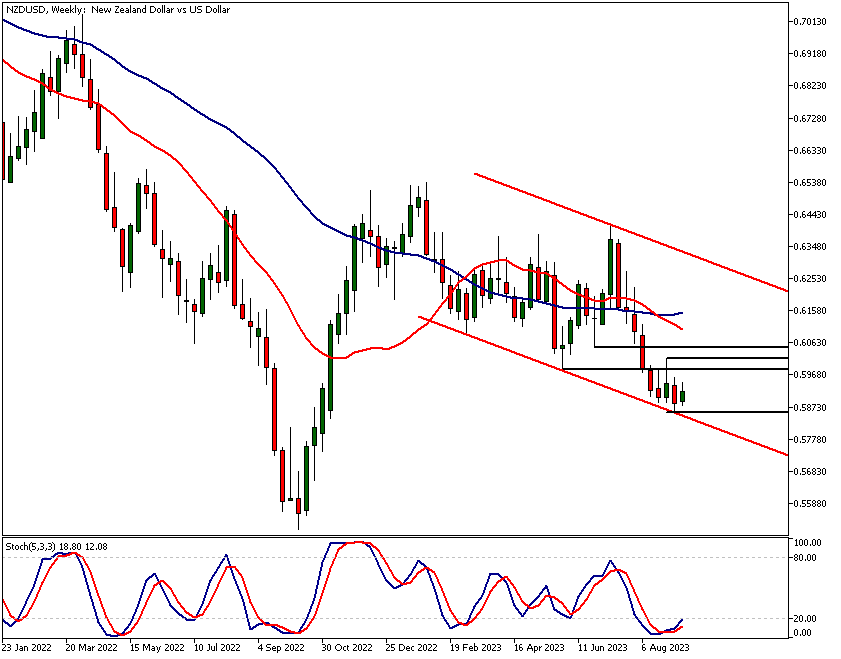
NZDUSD technical analysis, weekly chart
In the weekly chart NZDUSD is oversold as per Stochastic Oscillator (5.3.3.). The oscillator is turning higher and only just breaching the 20-point threshold level. A crossing over of this oversold threshold level is considered a buy signal but as always needs to be confirmed by other key technical factors.
Stochastic oscillator as a buy signal
One of the key factors to consider when interpreting the Stochastic Oscillator as a buy signal is price action. Specifically, the merit of the Stochastic signal is enhanced if the market can create higher lows in shorter timeframes, such as the daily and 4-hour charts. Another approach to validating the buy signal is to observe when the stochastic line crosses above its signal line.
Waning downside momentum
NZDUSD technical analysis reveals that two weeks ago the stochastic line has moved above the signal line. This suggests that the downside momentum may be waning, and the market could be poised for a pause in its current downtrend.
Price channel analysis
In addition to the Stochastic Oscillator, NZDUSD technical analysis also indicates an oversold market through price channel analysis. Over the recent three to four weeks, the downside movement has been constrained by the lower boundary of the descending price channel.
Resistance cluster
Despite the oversold conditions, NZDUSD faces a barrier in the form of a resistance cluster, ranging between 0.5984 and 0.6050. This zone is likely to act as a significant resistance area in the foreseeable future.
Adding complexity to the technical landscape, a shooting star candle was observed on the weekly chart two weeks ago. This bearish candle formation indicates that bulls are not yet in control of the market.
Resistance area and rally failure
The shooting star formation also serves as a rally failure signal, as the high of the candle occurred within the resistance zone of 0.5984 to 0.6050. This further underscores the significance of this resistance area in the market’s future direction.
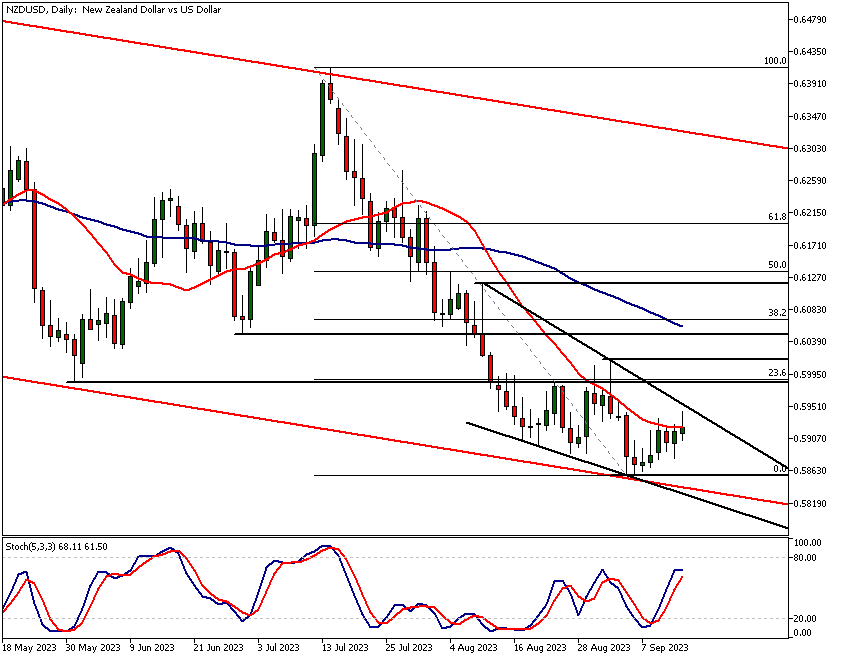
NZDUSD technical analysis, daily chart
The daily chart also shows a bullish wedge formation developing near the bear channel low. In this formation, the upper end and the lower end are nearing each other.
Convergence in bullish wedge
The convergence in the bullish wedge formation on the daily chart signals a possible weakening in bearish forces. This could set the stage for a breakout above the higher end of the wedge, particularly if there is substantial bullish momentum.
Measured move target in case of strong breakout
Should NZDUSD breakout forcefully, traders should utilise the measured move target to assess immediate upside potential. According to this projection, a strong breakout could propel the market to approximately 0.6105. However, this bullish scenario is contingent upon decisively breaking through the 0.5984 - 0.6050 resistance area.
Potential for downtrend continuation
NZDUSD technical analysis shows that if the market fails to breakout from the bullish wedge, a continuation of the downtrend is likely. A decisive breach below the 0.5859 low could direct the market into the 0.5740 – 0.5820 range.
The daily SMA(50) and SMA(20) are both pointing lower, with the fast SMA situated below the slow SMA, indicating bearish momentum. However, it's essential to remember that indicators follow price action; they don't lead it. Hence, the most weight should be given to the price action itself.
Stochastic oscillator at critical level
The stochastic oscillator is currently just above the 68 level, a pivotal zone where it previously led to a lower reactionary high on the daily chart. This critical positioning, especially when near the wedge formation high, could potentially trigger another downward leg in the existing downtrend.
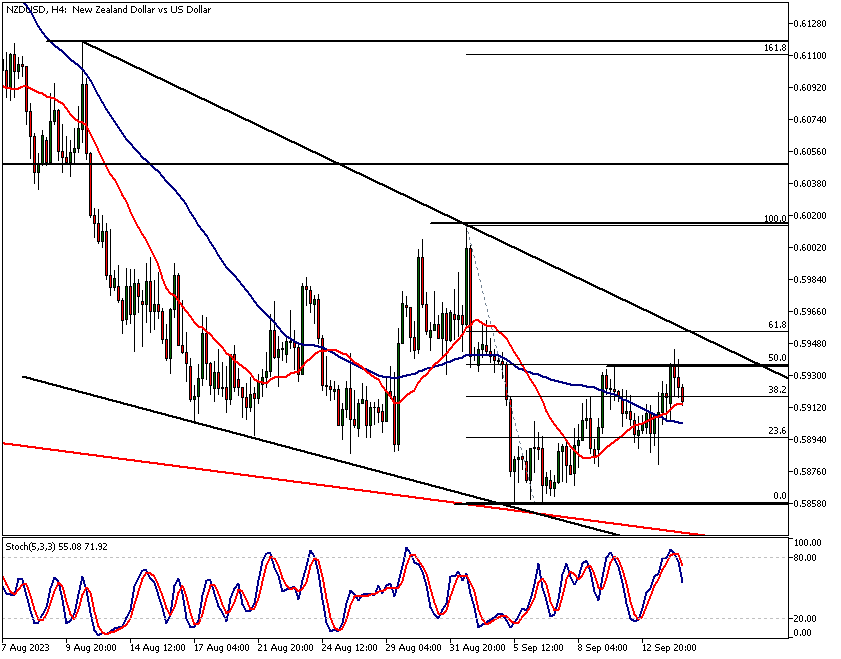
NZDUSD technical analysis, 4h chart
In the four-hour chart, the market is overbought as per Stochastic Oscillator. And, it has failed to stay above the 50% Fibonacci retracement level. If the market can’t reverse this process this sets a bearish intraday bias for today’s trading in NZDUSD.
NZDUSD technical analysis gives mixed signals when it comes to moving averages. The fast SMA(20) is above the slow SMA(50) but the 50 period SMA still points lower.
Impact from key risk events
Furthermore, the US Core PPI data release could play into NZDUSD price action today. As per our statistical analysis, NZDUSD is overall a more volatile currency pair.
This leads to the fact (also confirmed by statistics) the pair is likely to be more volatile also on days when US Core PPI data is released than the EURUSD pair.
Another key risk event that is likely to impact the NZDUSD pair today is the ECB rate decision. Typically, the NZDUSD currency is also the more volatile currency pair of the two on ECB rate decision days. As always, use NZDUSD technical analysis to estimate the best course of action through out the trading day.
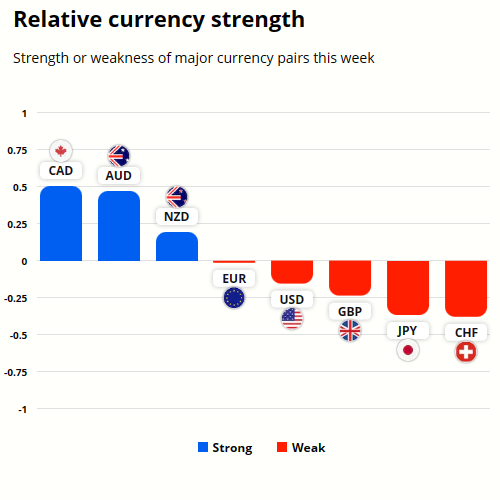
NZD and USD currency strength analysis
NZD is stronger than the USD but not by much. This indicates a fairly rangebound market over the recent days. CAD is the strongest while the CHF is the weakest currency today.
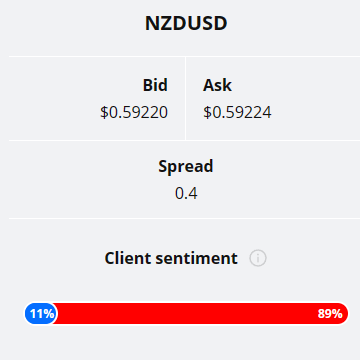
Client sentiment analysis
Almost 90% of TIOmarkets' clients are bearish on NZDUSD with only 11% holding a long position.
Please remember that the retail trader client sentiment is a contrarian indicator as most of the retail traders are on average betting against the market trends. This is why, experienced traders tend to trade against the retail client sentiment. You can follow the TIOmarkets client sentiment live on our Forex dashboard.
The key findings of the NZDUSD technical analysis:
- The weekly chart of NZDUSD shows an oversold condition based on the Stochastic Oscillator (5.3.3), which is just crossing the 20-point threshold. A confirmed buy signal could be indicated if the market also creates higher lows in lower timeframes like daily and 4h. Traders should also watch for the stochastic line crossing above the signal line for additional confirmation.
- NZDUSD faces a cluster of resistance levels between 0.5984 and 0.6050, as identified on the weekly chart. The shooting star candle formation two weeks ago highlights that this area is likely to remain a significant resistance zone in the near term.
- The daily chart reveals a bullish wedge formation near the bear channel low. A strong breakout above the formation could propel the market to approximately 0.6105, based on the measured move target. However, the bullish scenario requires decisiveness in overcoming the resistance levels between 0.5984 and 0.6050.
- If NZDUSD fails to break out from the bullish wedge, it might continue its downtrend. A decisive break below 0.5859 could send the currency pair into the 0.5740–0.5820 range. Both the daily SMA(50) and SMA(20) are pointing lower, suggesting bearish momentum.
- In the four-hour chart, NZDUSD appears overbought according to the Stochastic Oscillator. The market has also failed to sustain above the 50% Fibonacci retracement level. This sets a bearish intraday bias, especially if the fast SMA(20) crosses below the slow SMA(50).
- NZDUSD is generally more volatile and could be significantly affected by today’s US Core PPI data release and the ECB rate decision. Both events are statistically likely to increase volatility in NZDUSD compared to the EURUSD pair. Traders should exercise caution and adjust their positions accordingly.

The next main risk events
- EUR - Main Refinancing Rate
- EUR - Monetary Policy Statement
- USD - Core PPI
- USD - Core Retail Sales
- USD - PPI
- USD - Retail Sales
- USD - Unemployment Claims
- EUR - ECB Press Conference
- CNY - Industrial Production
- CNY - Retail Sales
- USD - Empire State Manufacturing Index
- USD - Industrial Production
- USD - Prelim UoM Consumer Sentiment
- USD - Prelim UoM Inflation Expectations
For more information and details see the TIOmarkets economic calendar.
While research has been undertaken to compile the above content, it remains an informational and educational piece only. None of the content provided constitutes any form of investment advice.
Tio Markets UK Limited is a company registered in England and Wales under company number 06592025 and is authorised and regulated by the Financial Conduct Authority FRN: 488900
Risk warning: CFDs are complex instruments and come with a high risk of losing money rapidly due to leverage. 82% of retail investor accounts lose money when trading CFDs with this provider. You should consider whether you understand how CFDs work and whether you can afford to take the high risk of losing your money. Professional clients can lose more than they deposit. All trading involves risk.
DISCLAIMER: Tio Markets offers an exclusively execution-only service. The views expressed are for information purposes only. None of the content provided constitutes any form of investment advice. The comments are made available purely for educational and marketing purposes and do NOT constitute advice or investment recommendation (and should not be considered as such) and do not in any way constitute an invitation to acquire any financial instrument or product. TIOmarkets and its affiliates and consultants are not liable for any damages that may be caused by individual comments or statements by TIOmarkets analysis and assumes no liability with respect to the completeness and correctness of the content presented. The investor is solely responsible for the risk of his/her investment decisions. The analyses and comments presented do not include any consideration of your personal investment objectives, financial circumstances, or needs. The content has not been prepared in accordance with any legal requirements for financial analysis and must, therefore, be viewed by the reader as marketing information. TIOmarkets prohibits duplication or publication without explicit approval.

Janne Muta holds an M.Sc in finance and has over 20 years experience in analysing and trading the financial markets.
