Risk disclaimer: 76% of retail investor accounts lose money when trading CFDs and Spreadbets with this provider. You should consider whether you understand how CFDs and Spreadbets work and whether you can afford to take the high risk of losing your money.
NZDJPY technical analysis | NZDJPY at a weekly bull channel low
BY Janne Muta
|September 11, 2023In this NZDJPY technical analysis we provide active traders with a comprehensive technical analysis of the NZDJPY currency pair across various timeframes—weekly, daily, and 4-hour. On a weekly timeframe, the NZDJPY pair has exhibited a notable rise of 11.6% since March, although it recently retraced around 3.5% from its YTD peak.
Bullish SMAs in the weekly chart
The Simple Moving Averages (SMA) 20 and 50 show a bullish alignment in the weekly chart. The pair is currently trading within an ascending weekly channel, and the stochastic oscillator has signalled a potential buy. In contrast, the daily NZDJPY technical analysis reveals downward-trending moving averages and a wide triangle formation, which suggests a market in a state of indecision.
NZDJPY in a range in the 4h timeframe
The 4-hour chart portrays a sideways market, where price fluctuations are occurring around the middle of the range. Key support and resistance levels are identified, with a focus on potential price reversals or breakout conditions. Traders are advised to seek additional confirmatory signals and be prepared to adjust strategies in line with market shifts.
The next key risk events
While this week is more quiet in the trading calendar the week after this is vital for this market. The next key risk events for this market are the New Zealand GDP release and the BOJ monetary policy statement.
NZDJPY technical analysis, key takeaways
- Immediate support for NZDJPY is at 85.78. A break below this could target the 50% Fibonacci level at 84.93, coinciding with SMA (50). Resistance is at 87.52; a break above could pave the way for 88.60 and potentially higher levels.
- On the daily chart, NZDJPY is in a state of indecision with downward-trending SMAs. A triangle formation is evident, with the stochastic oscillator around the 40 mark. Immediate support levels are at 84.93 and 85.78. A decisive break from the triangle could trigger significant market shifts.
- Should NZDJPY rally decisively today, it would bolster bullish sentiment. Conversely, a pronounced break below the rising channel low would render the market decidedly bearish. Immediate key support levels stand at 84.93 and 85.78.
- The 4-hour chart shows a sideways market, fluctuating around SMAs. Key support and resistance levels are at 85.78, 86.15, 87.25, and 87.52. The 86.15 and 87.52 levels align with the 38.2% and 22.6% Fibonacci levels respectively. Traders should look for price reversals at these levels or prepare for a breakout strategy.
Read the full NZDJPY technical analysis report below.
NZDJPY technical analysis, weekly timeframe
Weekly NZDJPY technical analysis
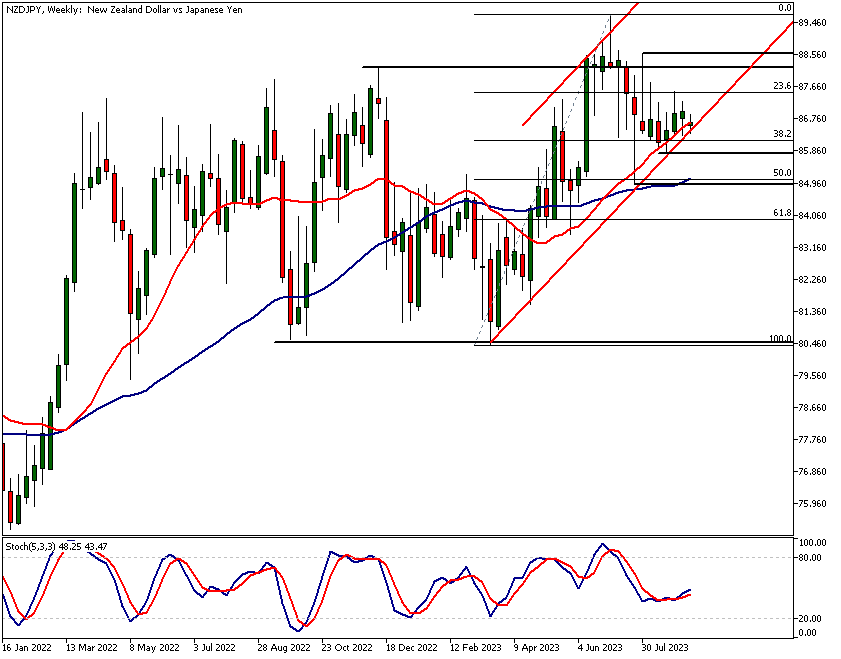
The NZDJPY pair has shown an 11.6% rise since March but recently retraced by 3.5% from its YTD peak of 89.69. In the weekly timeframe, the market trades within an ascending channel, with the lower bound at 86.45. This aligns with the 38.25% Fibonacci retracement level. The stochastic oscillator has signalled a buy, although traders should seek confirmatory signals in lower timeframes.
Bullish moving averages
Both SMA (20) and SMA (50) are in bullish alignment, with the faster SMA showing a more pronounced upward curve. Currently, the NZDJPY technical analysis reveals how the market trades inside a weekly ascending channel, the lower bound of which sits around 86.45, aligning closely with the previous week’s low at 86.29 and the 38.25% Fibonacci retracement level.
The stochastic oscillator has issued a buy signal, albeit it’d be wise to seek additional confirmatory price action signals in the lower timeframes before considering a trade.
Support and Resistance Zones
In the event of a NZDJPY moving lower, the immediate support to watch is at 85.78. Should this level give in to selling pressure, a lower swing high at 87.52, coupled with the break of this support, suggests the initiation of a more significant down move.
In such a case, the 50% Fibonacci level, which coincides with the SMA (50) and a weekly swing low at 84.93, could come into play. Conversely, a decisive upward move past the resistance at 87.52 could pave the way for a rally towards the 88.60 level, potentially extending even further.
NZDJPY technical analysis, daily timeframe
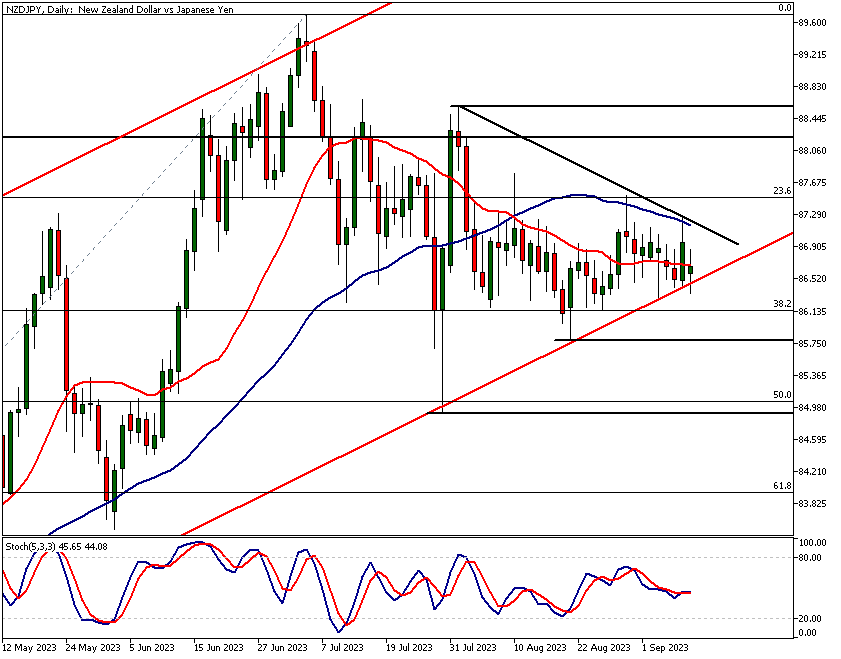
In the daily timeframe, the NZDJPY technical analysis shows that moving averages are trending downwards, with the fast SMA (20) positioned below the slower SMA (50). A rising bull channel low, in conjunction with a series of diminishing swing highs since the onset of August, has resulted in the formation of an expansive triangle.
Stochastics hovering around 40
The stochastic oscillator hovers around the 40 mark, largely moving sideways and thus offering no distinct directional cues. This lateral movement is attributable to the recent languid price action, which is an integral element of the triangle formation that is currently taking shape in the market. A rupture in either direction from this formation could elicit a significant market shift.
A rally today could sustain the market above a support level
The daily chart reveals that although the market briefly dipped below the rising channel low, it has since reverted within its confines. Should the NZDJPY pair stage a decisive rally today, it would bolster the bull's confidence in the sustainability of the rising support.
Conversely, a pronounced break below this level today would alter the technical landscape, rendering it decidedly more bearish.
The immediate key support levels to monitor stand at 84.93 and 85.78. Should the market undertake a decisive plunge below the rising channel low, these are the levels at which one should anticipate movement.
NZDJPY technical analysis, 4h timeframe
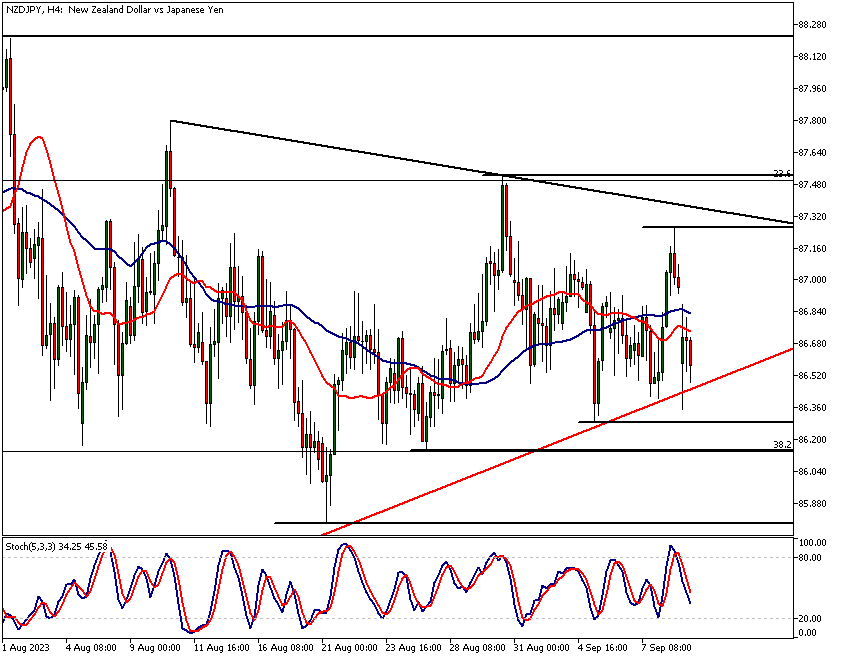
The 4h chart shows how Price fluctuates around the moving averages that are in the middle of the price range and point sideways. This is a typical sideways range market. The nearest support and resistance levels are 85.78, 86.15, 87.25 and 87.52. Note that the 86.15 and the 87.52 levels closely align with the 38.2% and 22.6% Fibonacci levels respectively.
Mean reversion market conditions
In ranging market strong momentum moves are rare. Instead, due to the mean orientation features strongly present in the market it is common to see the market trading to resistance or support levels and then bounce back.
Based on the NZDJPY technical analysis today intraday traders might want to look for signs of price reversals at the support and resistance levels until there is a decisive breakout from the range. Should a breakout from the range occur, look to change tactics and adopt trading strategies that benefit from momentum (opposite to the mean reversion plays).

JPY and NZD currency strength analysis
It is still early as the week has just started but today both JPY and NZD have performed all the other currencies but the AUD. USD is the weakest and the AUD the strongest currency today.
To gain better understanding on the potential future price moves in these currencies refer to the GBPNZD technical analysis above.
Client sentiment analysis
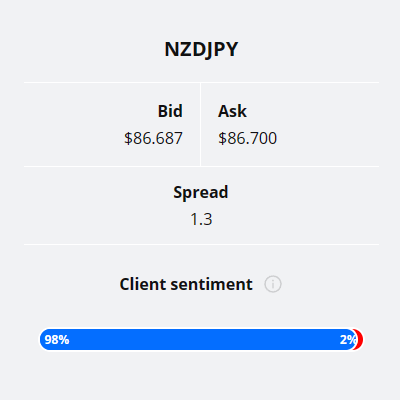
TIOmarkets clients are strongly bullish on NZDJPY currency pair with 98% of them long the currency pair. Only 2% are bullish on the market.
Please remember that the retail trader client sentiment is a contrarian indicator as most of the retail traders are on average betting against the market trends. This is why, experienced traders tend to trade against the retail client sentiment. You can follow the TIOmarkets client sentiment live on our Forex dashboard.
Stochastic oscillator in uptrends
For the benefit of new traders, let’s take a quick look at the stochastic oscillator. Buy signals from this indicator are traditionally considered to be generated when the %K line crosses above the %D line.
However, when a market is trending higher, the %K line typically crosses above the %D line at levels much higher than 20. The %K line is a fast-moving line that measures the closing price relative to the recent price range.
The %D line is a slower-moving line that is a moving average of the %K line. When the %K line crosses above the %D line, it is a signal that the security may be oversold and due for a rebound. This is known as a stochastic oscillator buy signal.
In a trending market, the %K line and the %D line are typically moving upwards together. This is because the closing price is rising relative to the recent price range. However, the %K line can move faster than the %D line, especially during periods of sharp price movements.
As a result, it is possible for the %K line to cross above the %D line at levels much higher than 20. This is because the %K line is already reflecting the recent price movements, while the %D line is lagging behind.
The key findings of the NZDJPY technical analysis are as follows:
- The NZDJPY pair has been in an uptrend since March 2023, but it has recently retraced some of its gains.
- The weekly timeframe shows that the pair is trading within an ascending channel, with the lower bound at 86.45. This aligns with the 38.25% Fibonacci retracement level. The stochastic oscillator has signalled a buy, although traders should seek confirmatory signals in lower timeframes.
- The daily timeframe shows that the moving averages are trending downwards, with the fast SMA (20) positioned below the slower SMA (50). A triangle formation is evident, with the stochastic oscillator around the 40 mark. Immediate support levels are at 84.93 and 85.78. A decisive break from the triangle could trigger significant market shifts.
- The 4-hour timeframe shows a sideways market, fluctuating around SMAs. Key support and resistance levels are at 85.78, 86.15, 87.25, and 87.52. The 86.15 and 87.52 levels align with the 38.2% and 22.6% Fibonacci levels respectively. Traders should look for price reversals at these levels or prepare for a breakout strategy.

The next main risk events
- AUD - NAB Business Confidence
- GBP - Claimant Count Change
- GBP - Average Earnings Index
- EUR - German ZEW Economic Sentiment
- GBP - GDP
- USD - Core CPI
- USD - CPI
- AUD - Employment Change
- AUD - Unemployment Rate
- EUR - Main Refinancing Rate
- EUR - Monetary Policy Statement
- USD - Core PPI
- USD - Core Retail Sales
- USD - PPI
- USD - Retail Sales
- USD - Unemployment Claims
- EUR - ECB Press Conference
- CNY - Industrial Production
- CNY - Retail Sales
- USD - Empire State Manufacturing Index
- USD - Industrial Production
- USD - Prelim UoM Consumer Sentiment
- USD - Prelim UoM Inflation Expectations
For more information and details see the TIOmarkets economic calendar.
While research has been undertaken to compile the above content, it remains an informational and educational piece only. None of the content provided constitutes any form of investment advice.
Tio Markets UK Limited is a company registered in England and Wales under company number 06592025 and is authorised and regulated by the Financial Conduct Authority FRN: 488900
Risk warning: CFDs are complex instruments and come with a high risk of losing money rapidly due to leverage. 82% of retail investor accounts lose money when trading CFDs with this provider. You should consider whether you understand how CFDs work and whether you can afford to take the high risk of losing your money. Professional clients can lose more than they deposit. All trading involves risk.
DISCLAIMER: Tio Markets offers an exclusively execution-only service. The views expressed are for information purposes only. None of the content provided constitutes any form of investment advice. The comments are made available purely for educational and marketing purposes and do NOT constitute advice or investment recommendation (and should not be considered as such) and do not in any way constitute an invitation to acquire any financial instrument or product. TIOmarkets and its affiliates and consultants are not liable for any damages that may be caused by individual comments or statements by TIOmarkets analysis and assumes no liability with respect to the completeness and correctness of the content presented. The investor is solely responsible for the risk of his/her investment decisions. The analyses and comments presented do not include any consideration of your personal investment objectives, financial circumstances, or needs. The content has not been prepared in accordance with any legal requirements for financial analysis and must, therefore, be viewed by the reader as marketing information. TIOmarkets prohibits duplication or publication without explicit approval.

Janne Muta holds an M.Sc in finance and has over 20 years experience in analysing and trading the financial markets.
