Risk disclaimer: 76% of retail investor accounts lose money when trading CFDs and Spreadbets with this provider. You should consider whether you understand how CFDs and Spreadbets work and whether you can afford to take the high risk of losing your money.
GBPNZD technical analysis | Consolidation above a key support zone
BY Janne Muta
|October 5, 2023GBPNZD technical analysis - Following a remarkable rally of 14.6% from the January low, the GBPNZD currency pair met a major resistance level in August, leading to a near 6% decline thereafter. This downturn was halted last week as the market touched a crucial technical confluence zone, defined by the 38.2% Fibonacci retracement level and a historical market structure level at 2.0326.
Historical price levels
This particular market structure level had previously resisted GBPNZD price advances in October 2022 and April 2023, hence the current price action carries significant implications for the forthcoming days and weeks in this market.
Indicator Analysis
Additionally, the stochastic oscillator is navigating the oversold territory, hinting at a possible buy signal. The fast 20-period and the slow 50-period moving averages uphold a bullish order, with the fast SMA situated above the slow.
It is crucial to note that in our GBPNZD technical analysis we regard all technical indicators as merely derivatives of price action. This underscores the importance of price action as the primary source for our market analysis and views.
The next key risk events for GBPNZD are
- GBP - Halifax House Price Index
- GBP - BRC Retail Sales Monitor
- NZD - Food Inflation
- GBP - GDP
- NZD - Business NZ PMI
The key takeaways from this GBPNZD technical analysis report
- A noted 14.6% rally since January led GBPNZD to a major resistance in August, post which it declined nearly 6%. The substantial downturn ceased last week at a technical Confluence Zone, with the current price action holding weight for the market's outlook in the ensuing days and weeks.
- The potential bullish setup is contingent on the market sustaining its bullish momentum. The prevailing bullish order, with the fast 20-period SMA above the slow 50-period, may usher in a positive market phase if the momentum persists.
- The 23.6% Fibonacci retracement level at 2.0583 emerged as a supply point post a strong rally. To reverse the recent downtrend and continue the rally, surpassing this level is crucial. Maintaining levels above 2.0583 could propel the market towards the next technical confluence area between 2.0715 - 2.0778.
- The 4-hour chart showcases a series of higher lows and highs, alluding to a budding uptrend. With the first moving average crossing above the slow, a bullish convergence is indicated. The market might challenge yesterday's high at 2.0583 if another higher reactionary low is created on the four-hour chart, thus today’s price action is critical in shaping forthcoming market sentiment.
- The article presents various scenarios based on technical indicators and price levels. It explores the potential ascent to a 23.6% Fibonacci retracement level at 2.0797 if the market continues rising from the confluence zone, or a descent to 2.0149 should the pairs drive the market below 2.0274.
- The critical price levels are identified through different Fibonacci retracement levels across daily and four-hour charts. The importance of surpassing or maintaining certain levels to continue bullish trends or to avoid further declines is emphasized, offering a nuanced understanding for intraday traders.
Read the full GBPNZD technical analysis report below.
GBPNZD technical analysis
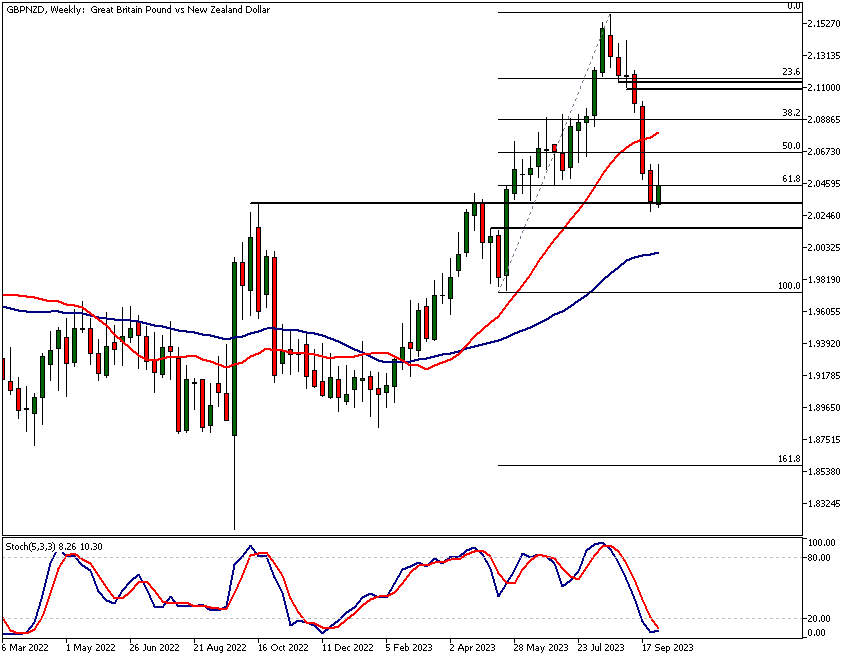
Weekly GBPNZD technical analysis
Following a strong rally of 14.6% since the January low, GBPNZD encountered a major resistance level in August and has since declined almost 6%. This substantial downturn was stopped last week when the market reached a critical technical Confluence Zone, created by the 38.2% Fibonacci retracement level and a historical market structure level at 2.0326.
Historical S&R level
We have noted in our previous GBPNZD technical analysis reports how this market structure level resisted GBPNZD price advances in October 2022 and April 2023. Therefore, the current price action holds significant implications for the days and weeks ahead in this market.
Bullish Setup Emergence
Indicator based GBPNZD technical analysis suggests a bullish setup could be emerging over the coming days. The stochastic oscillator is firmly in the oversold territory and could soon generate a buy signal, contingent on the market's ability to maintain bullish momentum. The fast 20-period moving average and the slow 50-period moving average maintain a bullish order with the fast SMA positioned above the slow.
Importance of Price Action
It's good to remember, however, that all technical indicators are merely derivatives of the price action; it is the price that influences the indicators, not vice versa. Consequently, price action itself is the most pivotal indicator, as it represents the collective sentiment of all market participants at any given moment. This is why in our GBPNZD technical analysis all the observations and technical indications are subject to the price action itself.
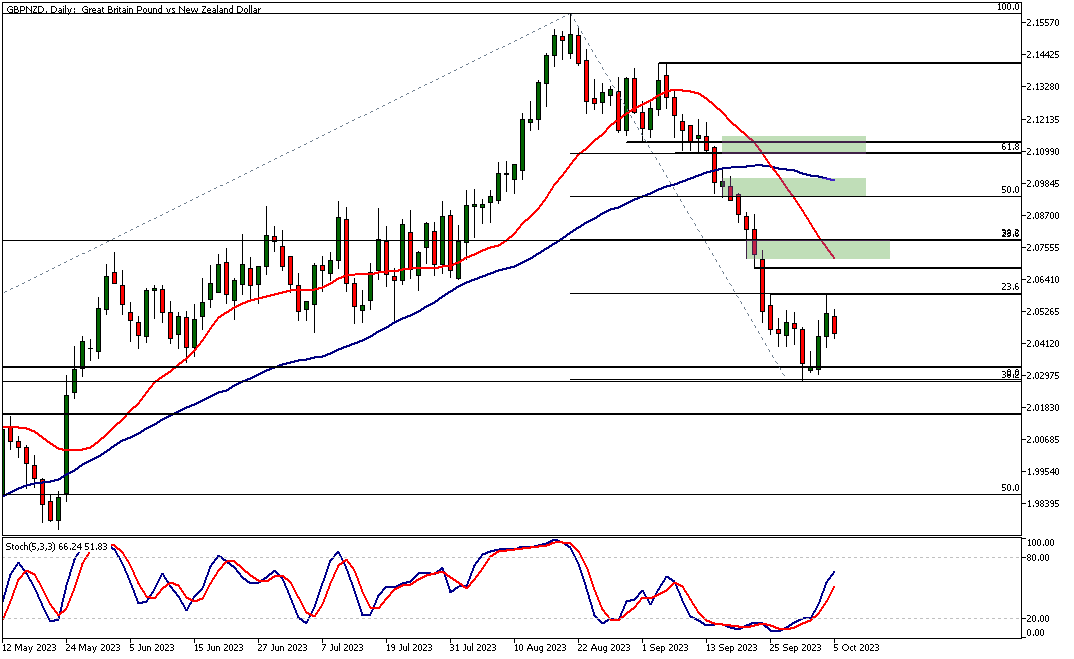
Daily GBPNZD technical analysis
Following a strong rally yesterday and day before, GBPNZD encountered some supply at the 23.6% Fibonacci retracement level at 2.0583. Note that a new set of Fibonacci retracement levels has been drawn from the August high to the most recent low to help us in tracking the extent to which the market retraces the recent decline from the August high.
Potential Market Movements
The Fibonacci retracement levels also mark potentially critical price levels, the nearest of which is the 23.6% retracement level at 2.0583. To continue the rally and reverse the recent downtrend, GBPNZD needs to surpass this level.
Our GBPNZD technical analysis indicates that should the bulls maintain levels above 2.0583, the market could trade higher to the next technical confluence area, created by the 20-period SMA and the 38.6% retracement level (2.0715 - 2.0778).
Technical Confluence Zones
However, this area lacks a strong market structure level, implying it may not be a significant resistance area and could be breached. A breach here could bring the technical confluence zone around the 50% retracement level into play (between 2.0925 and 2.0995).
Again, with no significant market structure level inside, this confluence zone could be yet another weak resistance zone. GBPNZD technical analysis with the daily chart reveals that the first confluence zone containing a market structure level can be found between the 61.8% Fibonacci retracement level and a resistance level at 2.1156.
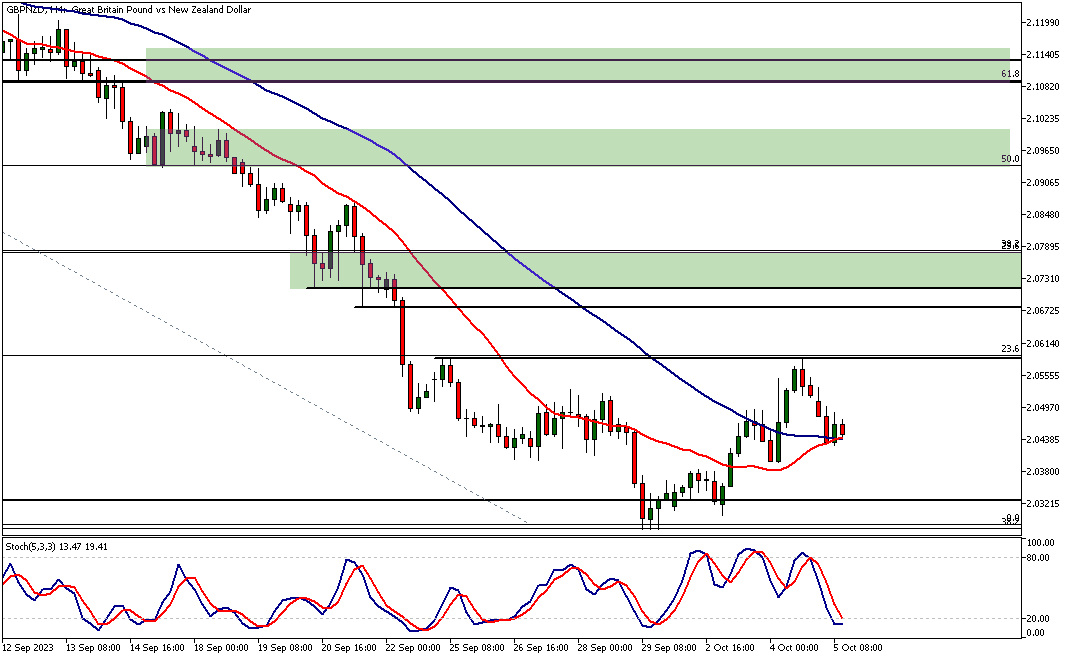
4h GBPNZD technical analysis
The 4-hour chart reveals a series of higher lows and higher highs, hinting at an attempt to create an uptrend in this timeframe. Should that be the case, the probability of GBPNZD pushing through the 23.6% Fibonacci retracement level increases.
If the breakout was decisive the market could test the minor resistance levels at 2.0679 and 2.0716.
Potential trend reversal
Such a move could potentially pave the way for higher prices and might also create a trend reversal. Thus, today's price action is highly critical and could shape the market sentiment over the ensuing days and possibly even weeks.
Moving Average Convergence
The first moving average is about to cross above the slow, indicating a bullish convergence in the moving average, and indicating a loss of downside momentum coupled with a gain in upside momentum.
The 4-hour GBPNZD technical analysis suggests that should we see another higher reactionary low created on the four-hour chart, the market might challenge yesterday's high at 2.0583 today. However, if this bullish trend falters, look for a move to last week's low at 2.0313.
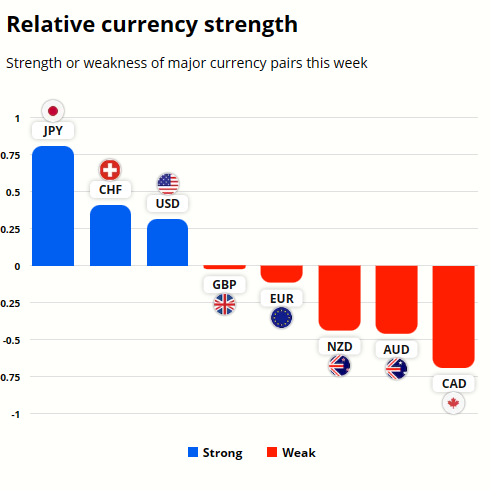
GBP and NZD currency strength analysis
The GBP and NZD have both been relatively weak currencies this week, with GBP outperforming NZD. The JPY has been the strongest currency this week, while CAD has been the weakest.
To gain better understanding on the potential future price moves in these currencies refer to the GBPNZD technical analysis above.
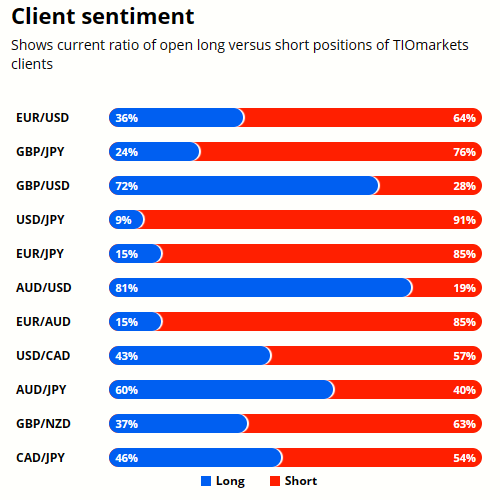
Client sentiment analysis
TIOmarkets clients are bearish GBPNZD with 63 % of the client base holding short positions in the currency pair while 37% are currently long the market.
Please remember that the retail trader client sentiment is a contrarian indicator as most of the retail traders are on average betting against the market trends. This is why, experienced traders tend to trade against the retail client sentiment. You can follow the TIOmarkets client sentiment live on our Forex dashboard.

The next main risk events
- USD - Unemployment Claims
- CAD - Ivey PMI
- CHF - Foreign Currency Reserves
- CAD - Employment Change
- CAD - Unemployment Rate
- USD - Average Hourly Earnings m/m
- USD - Non-Farm Employment Change
- USD - Unemployment Rate
- USD - FOMC Member Waller Speaks
For more information and details see the TIOmarkets economic calendar.
While research has been undertaken to compile the above content, it remains an informational and educational piece only. None of the content provided constitutes any form of investment advice.
Tio Markets UK Limited is a company registered in England and Wales under company number 06592025 and is authorised and regulated by the Financial Conduct Authority FRN: 488900
Risk warning: CFDs are complex instruments and come with a high risk of losing money rapidly due to leverage. 82% of retail investor accounts lose money when trading CFDs with this provider. You should consider whether you understand how CFDs work and whether you can afford to take the high risk of losing your money. Professional clients can lose more than they deposit. All trading involves risk.
DISCLAIMER: Tio Markets offers an exclusively execution-only service. The views expressed are for information purposes only. None of the content provided constitutes any form of investment advice. The comments are made available purely for educational and marketing purposes and do NOT constitute advice or investment recommendation (and should not be considered as such) and do not in any way constitute an invitation to acquire any financial instrument or product. TIOmarkets and its affiliates and consultants are not liable for any damages that may be caused by individual comments or statements by TIOmarkets analysis and assumes no liability with respect to the completeness and correctness of the content presented. The investor is solely responsible for the risk of his/her investment decisions. The analyses and comments presented do not include any consideration of your personal investment objectives, financial circumstances, or needs. The content has not been prepared in accordance with any legal requirements for financial analysis and must, therefore, be viewed by the reader as marketing information. TIOmarkets prohibits duplication or publication without explicit approval.

Janne Muta holds an M.Sc in finance and has over 20 years experience in analysing and trading the financial markets.
