Risk disclaimer: 76% of retail investor accounts lose money when trading CFDs and Spreadbets with this provider. You should consider whether you understand how CFDs and Spreadbets work and whether you can afford to take the high risk of losing your money.
GBPAUD analysis | Economic divergence intensified selling in GBPAUD
BY Janne Muta
|September 22, 2023This comprehensive GBPAUD analysis focuses on the GBPAUD currency pair using multi timeframe analysis as well as examines the fundamental landscapes in both the UK and Australia.
On the technical side, the market has recently broken a bullish trend channel on the weekly chart, currently trading below the 20-period moving average.
Technical Indicators and Client Sentiment
Key technical confluence zones are identified, with 1.8850 serving as a significant support level. The stochastic oscillator indicates an oversold condition, suggesting caution. On the daily and 4-hour charts, bearish momentum prevails, further corroborated by client sentiment and fundamental factors.
Macroeconomic Factors: UK vs Australia
The UK economy faces challenges of high inflation and a contracting labour market, while Australia contends with persistently high inflation and declining consumer sentiment.
Today's Economic Data
Today's PMI and retail sales data releases intensified selling in GBPAUD currency pair as the data further emphasise the diverging trajectories of the UK and Australian economies. Australia's services sector is showing signs of resilience and growth, with firms increasing their employment levels.
Economic Contraction in the UK
In contrast, the UK is experiencing contractions in both its manufacturing and services sectors, accompanied by weakening business sentiment. While both countries face inflationary pressures, the effects on the UK could be more wide-ranging given its higher inflation rate.
Utilise our GBPAUD analysis insights when assessing the market implications of the economic divergence between the UK and the Australian economies.
The GBPAUD analysis report, key takeaways:
- The GBPAUD currency pair has recently broken a bullish trend channel on its weekly chart and is trading below the 20-period moving average. This breach suggests a bearish outlook, pointing to a likely test of the 1.8850 support level, which coincides with the 38.2% Fibonacci retracement.
- The stochastic oscillator for GBPAUD indicates an oversold condition with a value of 13.83, falling well below the threshold level of 20. Traders should exercise caution as this could mean either a short-term reversal or a continuation of the existing downtrend.
- On the daily and 4-hour charts, bearish momentum prevails in GBPAUD trading. The fast-moving average (20-period) is set to cross below the slow-moving average (50-period), reinforcing the bearish sentiment. This provides an additional cue for traders to consider short positions.
- The UK economy faces high inflation rates and a contracting labour market, creating fundamental pressures on the GBP. Australia, on the other hand, grapples with high inflation but shows resilience in its services sector, which could influence GBPAUD dynamics.
- Approximately 63% of retail traders are long on GBPAUD, according to TIOmarkets' client sentiment data. Given that retail sentiment often serves as a contrarian indicator, this skew towards long positions may validate the current bearish momentum in the market.
- Today's PMI and retail sales data underline the diverging economic paths of the UK and Australia. The resilience in Australia's services sector contrasts sharply with the UK's weakening manufacturing and services sectors, providing timely fundamental cues for intraday GBPAUD trading.
The next key risk events for GBPAUD are
- AUD CPI (Wednesday September 27th)
- GBP GDP Growth Rate (Friday September 29th)
GBPAUD analysis
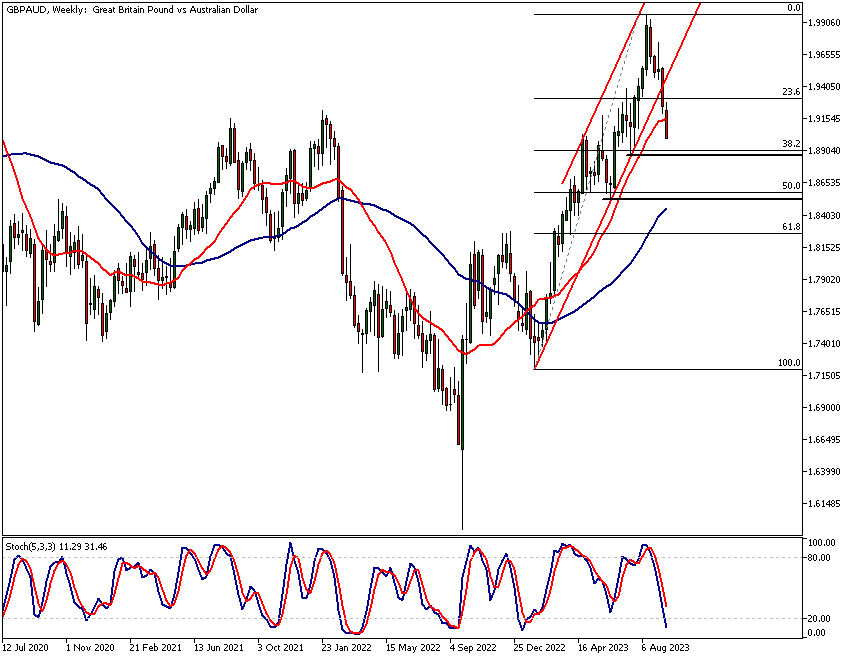
GBPAUD analysis, weekly chart
Over the last two weeks, the market has broken below the bullish trend channel in which it was previously trading. After breaching the channel's lower boundary, the market has moved to the 20-period moving average and is currently trading slightly below it.
Key Support Levels and Technical Confluence
GBPAUD analysis shows that the next key support level for the currency pair is at 1.8850. This level is closely aligned with the 38.2% Fibonacci retracement level. Consequently, the 1.8850 region serves as a technical confluence area and could potentially be a significant support level. On the weekly chart, the nearest key resistance levels are situated at 1.9465 and 1.9749.
Stochastic Oscillator Analysis
As for the stochastic oscillator, it is currently in an oversold condition. At the time of writing, its value is 13.83, which is well below the oversold threshold level of 20. We hope that by incorporating the technical and fundamental GBPAUD analysis and fundamentals you will be able to enhance your trading strategy.
Downside Momentum and Volatility
Since breaking the rising support, GBPAUD has experienced a nearly 2% decline, indicating strong downside momentum. An increase in downside volatility often perpetuates further declines, making it plausible that the market could test the 1.8850 confluence level.
Importance of Buyer Engagement for Market Direction
While it is certainly possible that the market could reverse and move higher, it is not possible to evaluate the probabilities of such an upward movement until there are signs of engagement from buyers. This underscores the value of daily updates on GBPAUD analysis for gauging market direction.
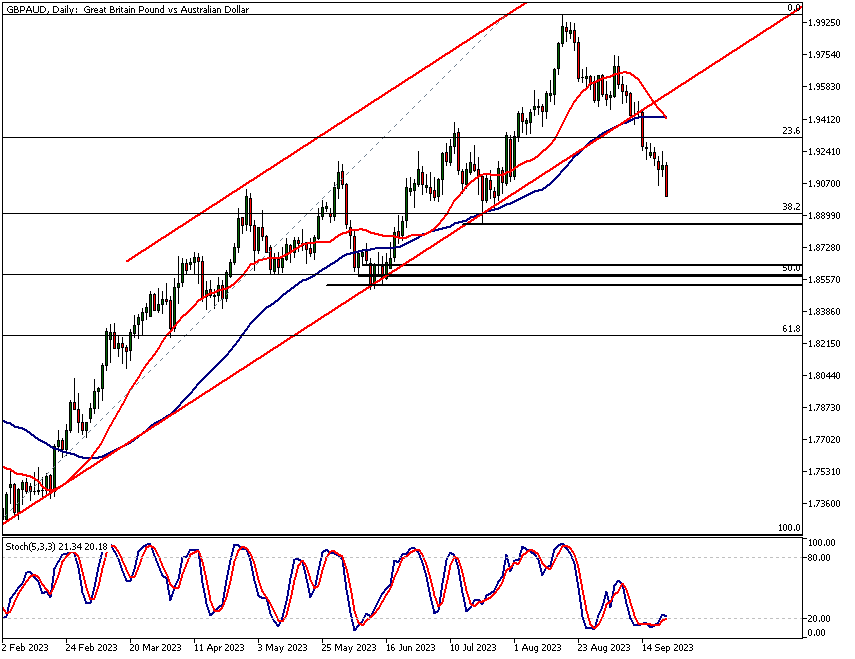
GBPAUD analysis, daily chart
The daily timeframe chart reveals that GBP/AUD is in a downtrend. Since the market broke out of its bullish trend channel, it has traded over 400 points lower. Currently, the fast-moving average (with a look-back period of 20) is poised to cross below the slow-moving average (with a look-back period of 50).
Although the stochastic oscillator has crossed above the oversold threshold of 20, this indicator alone is unlikely to create conditions for the market to move significantly higher.
Resistance Levels on the Daily Chart
In the daily chart, the nearest resistance level is situated at 1.9240. Our GBPAUD analysis indicates that hould the market rally above this level, the subsequent area of resistance that is likely to impede price advancement ranges from 1.9420 to 1.9465.
Significance of the Technical Confluence Zone
This range is significant because it not only aligns with both moving averages, but also coincides with a market structure level at 1.9465. Consequently, this area can be considered a significant technical confluence zone and is likely to attract the attention of numerous market operators. If the market rallies to this area, it could invite profit-taking, potentially slowing down the upward movement or even reversing it.
Bearish Momentum and Next Confluence Area
On the other hand, if the current bearish momentum persists, the GBPAUD analysis shows, it would be prudent to anticipate a move towards the next technical confluence area. This zone lies between a support level at 1.8850 and the 38.2% Fibonacci retracement level at 1.8933.
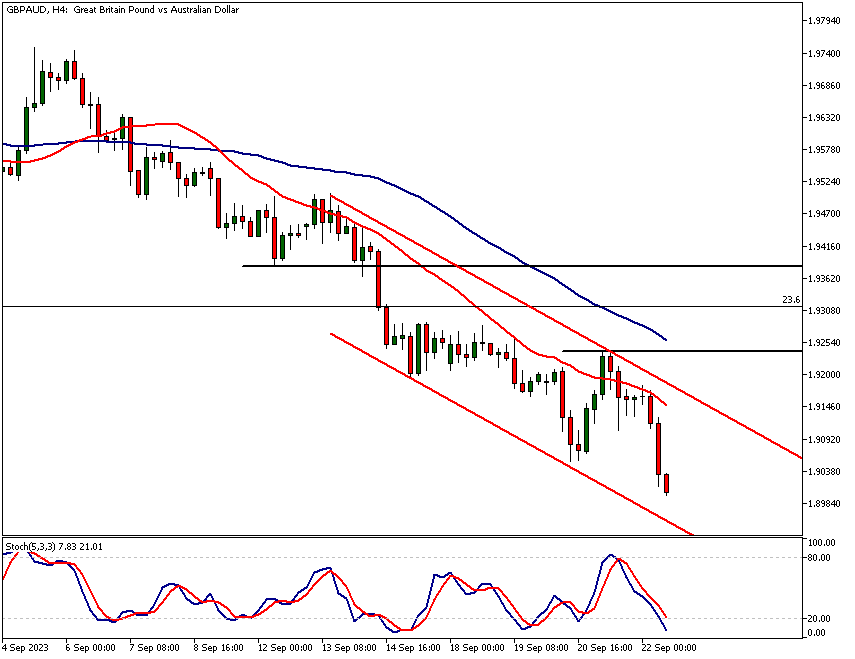
GBPAUD analysis, 4h chart
In the 4-hour chart, the GBPAUD currency pair has established another lower high, consistent with the prevailing downtrend. The market attempted but failed to maintain upside momentum after reaching a sideways range above 1.9198.
Both the fast and slow moving averages are pointing lower, and they are arranged in a bearish order; the fast moving average is below the slow one. The stochastic oscillator issued a sell signal following the latest failed rally and is currently pointing downwards.
Oversold Conditions
It is worth noting that the market trending lower and has moved below its recent lows, causing the stochastic oscillator to near the oversold territory once again. In a downtrending market, it is common for the stochastic oscillator to enter oversold zones, but such occurrences rarely result in lasting upward moves.
Therefore, traders should focus their GBPAUD analysis on instances where the oscillator approaches overbought levels and then possibly issues a sell signal, as these could precipitate sustained downward movements.
Classical Technical Analysis
Applying traditional technical analysis rules to today's GBPAUD analysis, the latest swing high in the current downtrend is at 1.9240. According to classical technical analysis, GBPAUD would need to rally above this level and sustain that gain to reverse the downtrend.
Potential Pivot Points
Should the market muster sufficient strength to ascend above 1.9240, the next focal point on the 4-hour chart would be at 1.9381. Conversely, if the bearish momentum continues, one should anticipate a move to levels near the 1.8850 confluence zone.
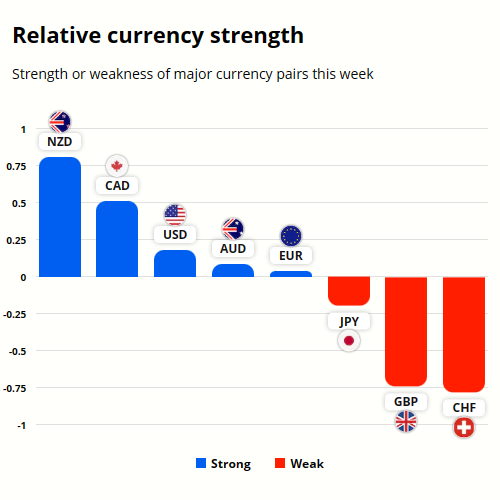
GBP and AUD currency strength analysis
GBP has been weak since the Bank of England chose to maintain the policy interest rate at 5.25%, signalling a pause in the two-year policy tightening trajectory. Sterling has been under pressure lately also due to the central bank expecting a significant decline in Consumer Price Index (CPI) inflation in the near term, AUD is also relatively weak with NZD, CAD and USD being stronger.
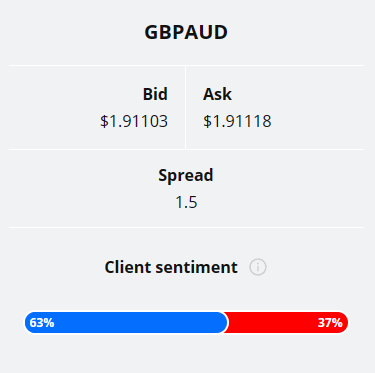
Almost two thirds (63%) of TIOmarkets' clients are currently holding long positions in the GBPAUD currency pair. It then follows that 37% of the client base are holding short positions.
Please remember that the retail trader client sentiment is a contrarian indicator as most of the retail traders are on average betting against the market trends. This is why, experienced traders tend to trade against the retail client sentiment. You can follow the TIOmarkets client sentiment live on our Forex dashboard.
Fundamental GBPAUD analysis
This section of the GBPAUD analysis report we provide our readers with a comprehensive analysis of the current economic landscapes in the UK and Australia. We cover key indicators such as inflation, labour market trends, consumer spending, economic growth, and trade balances. The analysis concludes with a comparative overview, highlighting the unique challenges and opportunities each economy faces in today's complex global environment.
UK Economy Overview
The UK economy is currently experiencing a high inflationary environment, albeit with some signs of easing. Consumer Price Index (CPI) inflation registered at 6.7% in August 2023, a slight dip from the preceding month. This reduction is attributed to declines in food, accommodation, and other categories. Notably, the Bank of England has chosen to maintain the policy interest rate at 5.25%, indicating a wait-and-see approach amid mixed signals.
Labour Market Dynamics
Job creation in the UK has been on a decline, particularly for the three months ending in July 2023, where it fell by 207,000. This decline has led to an unemployment rate of 4.3%, the highest since Q3 2021. Despite this, wage growth has been robust, reaching levels not seen since 2001.
Consumer Spending
Retail sales in August 2023 showed only marginal growth, increasing by 0.4% month-over-month, falling short of market expectations. This sluggish growth indicates that consumer spending remains subdued, possibly due to high inflationary pressures. Employ GBPAUD analysis, both technical and fundamental, to evaluate the impact of inflation data on market movements."
Economic Contraction and Sectoral Declines
The UK economy contracted by 0.5% in July 2023, reversing the growth of the previous month. The decline was primarily driven by a drop in the services sector, further exacerbated by strikes in the NHS and a decrease in computer programming activities.
Trade Balances
Trade data from July 2023 reveals a narrowing trade deficit, primarily due to a 1.8% increase in exports, especially to the European Union. This suggests some resilience in external economic activities.
Australian Economy Overview
The Reserve Bank of Australia (RBA) has maintained its cash rate at 4.1%. While inflation appears to have peaked, it remains elevated at 4.9% as of July 2023. The RBA aims to bring inflation back to its target range of 2-3% over a reasonable period.
Employment Trends
The Australian labour market appears resilient but is experiencing below-trend growth. The unemployment rate is expected to climb modestly to around 4.5% by late next year.
However, employment numbers have surged, exceeding market expectations. Note that GBPAUD analysis can offer a structured approach to understanding market sentiment when following the employment trends.
Consumer Sentiment
The Westpac-Melbourne Institute Consumer Sentiment index has registered close to its lowest level since the COVID-19 pandemic. This decline suggests that consumer spending might remain subdued in the near term.
Economic Growth
Australia recorded modest economic growth of 0.4% quarter-on-quarter in Q2 2023. Household consumption remains subdued, likely due to elevated interest rates and declining household savings.
Trade Situation
Australia’s trade surplus shrank to AUD 8.04 billion in July 2023, mainly due to a decline in exports, especially to China. This shrinking surplus could pose challenges to the external sector of the economy.
Comparative Analysis and Conclusion
Both the UK and Australian economies are challenged by high inflation, tightening labour markets, and subdued consumer activity. While the UK grapples with economic contraction and a somewhat unpredictable labour market, Australia is dealing with persistently high inflation and declining consumer sentiment.
Today's data releases further emphasise the diverging trajectories of the UK and Australian economies. Australia's services sector is showing signs of resilience and growth, with firms increasing their employment levels.
In contrast, the UK is experiencing contractions in both its manufacturing and services sectors, accompanied by weakening business sentiment. While both countries face inflationary pressures, the effects on the UK could be more wide-ranging given its higher inflation rate.
In Australia, the positive trends in the services sector could act as a counterbalance to the subdued consumer sentiment and below-trend growth in employment. Conversely, the UK's economic challenges appear to be deepening, with contractions in key sectors and a complex retail landscape.
Summary
In summary, today's data releases further indicate how the UK and Australian economies are diverging. While Australia seems to be stabilising with growth in the services sector and employment, the UK is grappling with contractions and declining business confidence.
Our GBPAUD analysis, we hope, offers you a clearer perspective on the potential market impact of today's data releases and the ongoing economic divergence between the economies.

The next main risk events
- CAD Core Retail Sales
- CAD Retail Sales m/m
- USD Flash Manufacturing PMI
- USD Flash Services PMI
- EUR German ifo Business Climate
- USD S&P/CS Composite-20 HPI
- USD CB Consumer Confidence
- USD New Home Sales
- USD Richmond Manufacturing Index
- AUD CPI
- USD Core Durable Goods Orders
- USD Durable Goods Orders
For more information and details see the TIOmarkets economic calendar.
While research has been undertaken to compile the above content, it remains an informational and educational piece only. None of the content provided constitutes any form of investment advice.
Tio Markets UK Limited is a company registered in England and Wales under company number 06592025 and is authorised and regulated by the Financial Conduct Authority FRN: 488900
Risk warning: CFDs are complex instruments and come with a high risk of losing money rapidly due to leverage. 82% of retail investor accounts lose money when trading CFDs with this provider. You should consider whether you understand how CFDs work and whether you can afford to take the high risk of losing your money. Professional clients can lose more than they deposit. All trading involves risk.
DISCLAIMER: Tio Markets offers an exclusively execution-only service. The views expressed are for information purposes only. None of the content provided constitutes any form of investment advice. The comments are made available purely for educational and marketing purposes and do NOT constitute advice or investment recommendation (and should not be considered as such) and do not in any way constitute an invitation to acquire any financial instrument or product. TIOmarkets and its affiliates and consultants are not liable for any damages that may be caused by individual comments or statements by TIOmarkets analysis and assumes no liability with respect to the completeness and correctness of the content presented. The investor is solely responsible for the risk of his/her investment decisions. The analyses and comments presented do not include any consideration of your personal investment objectives, financial circumstances, or needs. The content has not been prepared in accordance with any legal requirements for financial analysis and must, therefore, be viewed by the reader as marketing information. TIOmarkets prohibits duplication or publication without explicit approval.

Janne Muta holds an M.Sc in finance and has over 20 years experience in analysing and trading the financial markets.
