Risk disclaimer: 76% of retail investor accounts lose money when trading CFDs and Spreadbets with this provider. You should consider whether you understand how CFDs and Spreadbets work and whether you can afford to take the high risk of losing your money.
GBPNZD technical analysis | Bids softened after a rally to near 5-year highs
BY Janne Muta
|September 8, 2023The GBPNZD technical analysis report today reveals a market that has rallied strongly influenced by both technical and macroeconomic factors. The 11.43% year-to-date performance has been shaped significantly by divergent central bank policies in the UK and New Zealand.
Inflation trends: UK vs New Zealand
The UK's inflation rate has been not only higher but also more volatile than New Zealand's inflation rate. In July 2023, the UK's annual inflation rate was 6.8%, while New Zealand's annual inflation rate was 6%. The UK's inflation rate has fluctuated between 6.2% and 9% in the past year, while New Zealand's inflation rate has been more stable.
Divergent central bank policy objectives
The BOE has been more aggressive in raising interest rates than RBNZ. The Bank of England has raised interest rates five times since December 2021, while the Reserve Bank of New Zealand has raised interest rates four times since October 2021.
The different central bank policies in the UK and New Zealand reflect the different inflation trends. The BOE is more concerned about the risks of high inflation and has been therefore raising interest rates more aggressively. The RBNZ on the other hand is more concerned about the risks of a recession and is therefore raising interest rates more gradually.
GBPNZD technical analysis and key risk Events
On the GBPNZD technical analysis front, the market has corrected lower after nearing the five-year high in August. The market has been quite extended to the upside and is now trading inside a triangle formation. The upcoming risk events to watch include the UK Claimant Count Change, the UK Average Earnings Index 3m/y on Tuesday, and the UK GDP data release on Wednesday next week.
Read the full GBPNZD technical analysis report below.
GBPNZD technical analysis
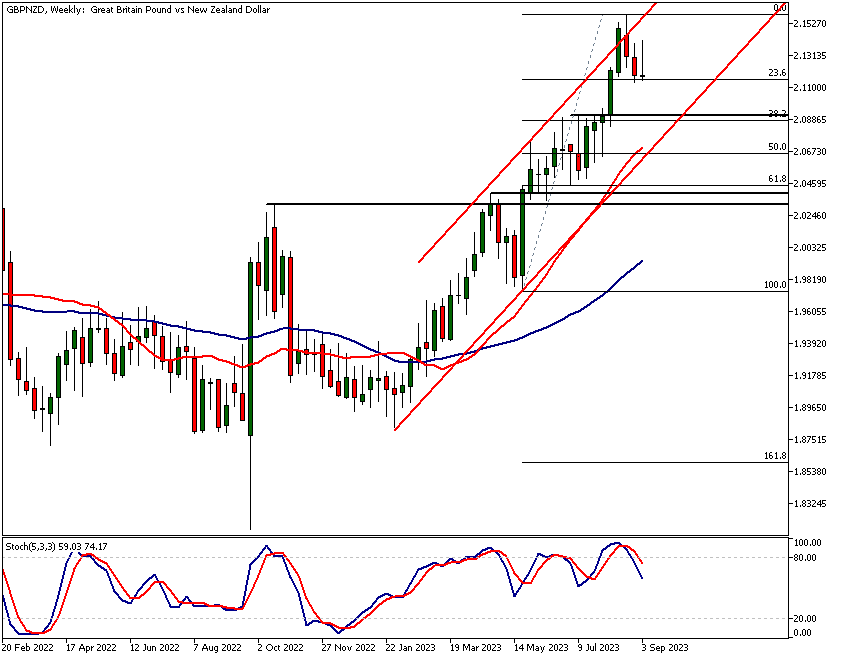
Weekly GBPNZD technical analysis
The GBPNZD market has retreated from near five-year highs, now trading within a triangle formation. A Stochastic Oscillator turning bearish signals potential downside.
GBPNZD has shown a strong performance this year. As of the time of writing this analysis, the year-to-date (YTD) gains stand at 11.43%, with peaks reaching as high as 14.7% when measured from the lowest point this year.
Three-Month Performance and Risk Assessment
While the three-month performance remains strong at 2.88%, the rally has taken the currency pair to a level where the potential value relative to the risk has diminished. This suggests that the market is becoming increasingly cautious, particularly as the initial rally began in February.
GBPNZD technical analysis show how the recent rally have took the market above the upper boundary of its bull channel. This break led to a 2.2% correction from its August high of 2.1586. The Stochastic Oscillator, a momentum indicator, has turned bearish, indicating a potential downturn.
Proximity to Five-Year High and Profit-Taking
The currency pair is trading close to its five-year high of 2.1767, making investors wary of a major resistance level. This has led to some profit-taking, especially considering the distance between the August high this year and the March 2020 high is less than 1%.
Key Support Levels and Fibonacci Retracements
GBPNZD's next support is at 2.0918, aligning with the 38.2% Fibonacci retracement. A break below could target 2.0700, where SMA (20) and the 50% retracement level converge.
Currently, the market is trading at the 23.6% retracement level, which lacks corresponding weekly support. GBPNZD technical analysis suggests that a further decline to 2.0918 is plausible before we see significant price upswings.
Potential Downside and Confluence Zones
If the price doesn't hold at the 38.2% retracement level, a move to 2.0700 could occur, where the 20-period Simple Moving Average (SMA) currently lies. Right below this is the crucial 50% retracement level, creating a technical confluence zone. Further below, the next major support is in the 2.0317 – 2.0450 range, which aligns with multiple market structure levels, including the bull channel low and the 61.8% Fibonacci retracement level.
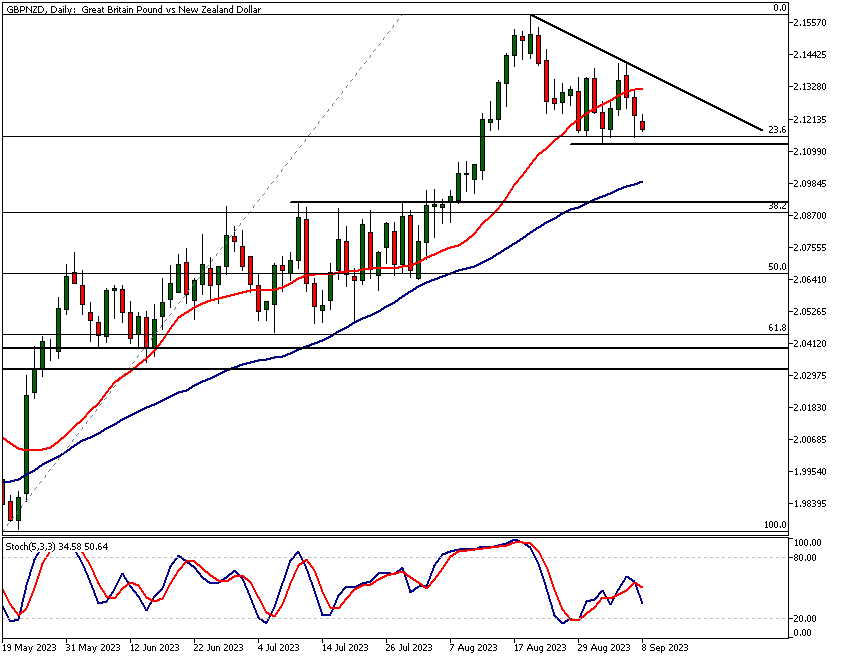
Daily GBPNZD technical analysis
In the daily timeframe chart GBPNZD is trading approximately at a support (2.1130) level that coincides with the 23.6% Fibonacci retracement level. If the market breaks below 2.1130 today, we have a lower swing high at 2.1414.
The breaking of the support level would indicate weakness and possibly move the market down to the SMA (50) at 2.0990. Note that the market structure level at 2.0918 is relatively close and closely aligns with the 38.2% Fibonacci retracement level.
But, if the market attracts enough buyers to maintain levels above the 2.1130 we should look for a move to 2.1410 or so. If the market breaks decisively out of the triangle formation to the upside the GBPNZD technical analysis shows market could reach levels near the August high (2.1586) again.
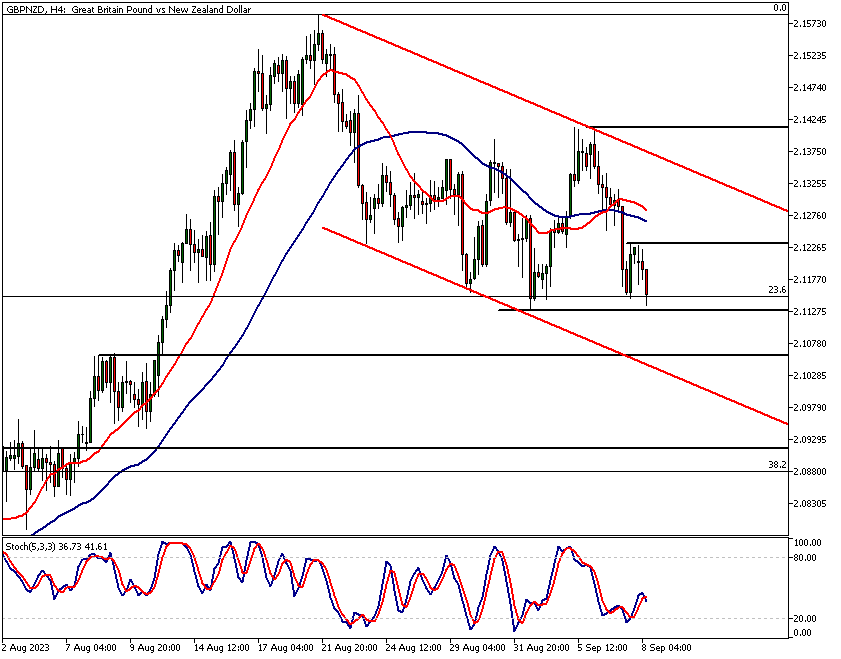
4h GBPNZD technical analysis
The triangle formation in the daily chart could be interpreted as a bearish price channel in the 4h chart. The market has created lower lows approximately aligning with the lower end of this descending price channel. As a result, the moving averages (20 and 50 periods) are both pointing lower even though the fast SMA is still above the slow.
Price moving inside the channel gives a bearish indication but at the same time, the 4h GBPNZD technical analysis shows the bulls trying to buy the market at 23.6% Fibonacci level yesterday.
Key Resistance and Support Levels
The rally failed quite quickly though and GBPNZD has created a minor resistance level at 2.1233. If this level is penetrated with some conviction, it could open the way to a rally to the upper end of the descending price channel (currently at 2.1370.
Alternatively, the market remains weak and might break the 2.1130 support. If there’s continued downside momentum below this level, look for a move to 2.1062 (a minor support level) and then possibly to 2.0946.
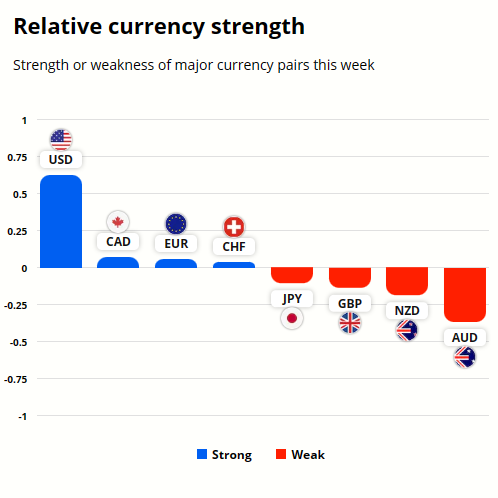
GBP and NZD currency strength analysis
This week both GBP and NZD have underperformed USD, CAD, EUR and CHF and JPY. Only AUD has been weaker than they.
To gain better understanding on the potential future price moves in these currencies refer to the GBPNZD technical analysis above.
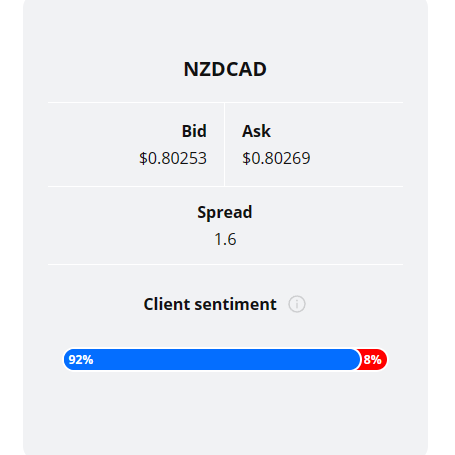
Client sentiment analysis
TIOmarkets clients are strongly bearish on GBPNZD with 96% of the client base short the currency pair while only 4% are bullish on the market.
Please remember that the retail trader client sentiment is a contrarian indicator as most of the retail traders are on average betting against the market trends. This is why, experienced traders tend to trade against the retail client sentiment. You can follow the TIOmarkets client sentiment live on our Forex dashboard.

The next main risk events
- CAD - Employment Change
- CAD - Unemployment Rate
- CNY - CPI
- CNY - PPI
For more information and details see the TIOmarkets economic calendar.
While research has been undertaken to compile the above content, it remains an informational and educational piece only. None of the content provided constitutes any form of investment advice.
Tio Markets UK Limited is a company registered in England and Wales under company number 06592025 and is authorised and regulated by the Financial Conduct Authority FRN: 488900
Risk warning: CFDs are complex instruments and come with a high risk of losing money rapidly due to leverage. 82% of retail investor accounts lose money when trading CFDs with this provider. You should consider whether you understand how CFDs work and whether you can afford to take the high risk of losing your money. Professional clients can lose more than they deposit. All trading involves risk.
DISCLAIMER: Tio Markets offers an exclusively execution-only service. The views expressed are for information purposes only. None of the content provided constitutes any form of investment advice. The comments are made available purely for educational and marketing purposes and do NOT constitute advice or investment recommendation (and should not be considered as such) and do not in any way constitute an invitation to acquire any financial instrument or product. TIOmarkets and its affiliates and consultants are not liable for any damages that may be caused by individual comments or statements by TIOmarkets analysis and assumes no liability with respect to the completeness and correctness of the content presented. The investor is solely responsible for the risk of his/her investment decisions. The analyses and comments presented do not include any consideration of your personal investment objectives, financial circumstances, or needs. The content has not been prepared in accordance with any legal requirements for financial analysis and must, therefore, be viewed by the reader as marketing information. TIOmarkets prohibits duplication or publication without explicit approval.

Janne Muta holds an M.Sc in finance and has over 20 years experience in analysing and trading the financial markets.
