Risk disclaimer: 76% of retail investor accounts lose money when trading CFDs and Spreadbets with this provider. You should consider whether you understand how CFDs and Spreadbets work and whether you can afford to take the high risk of losing your money.
Nasdaq technical analysis | The high CPI to push Nasdaq lower?
BY Janne Muta
|October 13, 2023Nasdaq technical analysis - The US September 2023 CPI data release yesterday sent Nasdaq lower after a two-week recovery. The US inflation rate stayed at 3.7%, slightly above forecasts of a 3.6% rate. A modest 0.5% drop in energy prices contributed to this stability. Inflation softened in multiple categories, and the core CPI dropped to 4.1%. Monthly consumer prices rose by 0.4%, exceeding market expectations of 0.3%.
Treasury Bond Auction
The equity markets were under added pressure after a Treasury bond auction revealed a lack of demand, causing Treasury yields to escalate even further. The S&P 500 declined 0.6% while, the Dow Jones Industrial Average dropped by 0.5%, and the tech-centric Nasdaq Composite retreated by 0.6%.
Sectoral Impact of the Downturn
The impact of this downturn was broad-based, affecting nine out of eleven sectors of the S&P 500, with the utilities and materials sectors bearing the brunt of the losses, dropping 1.5% each.
Market Expectations and Federal Reserve Stance
Despite the high CPI reading, market expectations remain fairly steady regarding the Federal Reserve's stance on maintaining the benchmark interest rate in the upcoming November meeting. Read our Nasdaq technical analysis report below to gain insights on how the market might move today.
The next key risk events for Nasdaq are
- Prelim UoM Consumer Sentiment
- Prelim UoM Inflation Expectations
- Empire State Manufacturing Index
- Retail Sales
Read the full Nasdaq technical analysis report below
Nasdaq technical analysis
Nasdaq technical analysis weekly
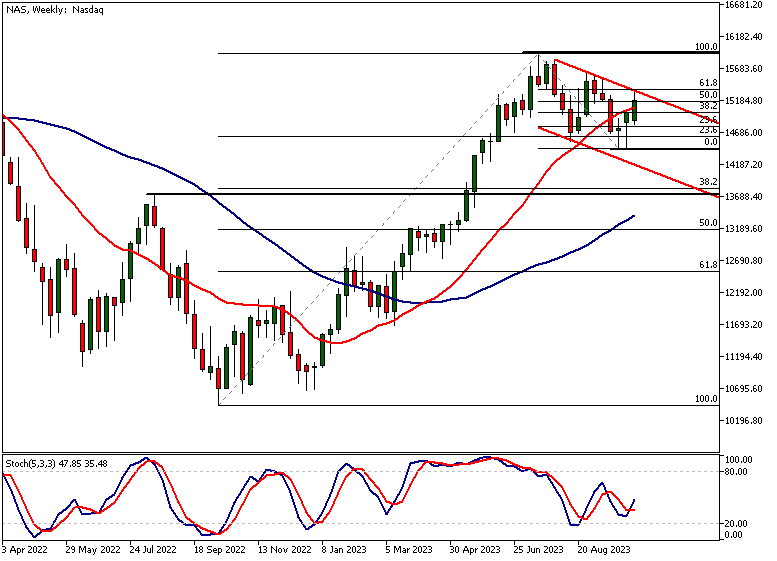
Over the last three weeks, Nasdaq has rallied approximately 5.4%. The rally started to falter yesterday as the market hit a descending resistance line, or the bearish trend channel high at 15,336. This level was also the 61.8% Fibonacci retracement level when measured from the July high to the latest reactionary low. As such the 15,336 level is a key confluence level and could prove to be a significant resistance level if challenged again over the coming days.
Reaction at 14,429
The latest swing low at 14,429 created a rather strong price reaction that resulted in two bullish rejection candles. This suggests that the market could be soon trying to break out of the bearish trend channel to the upside. If the breakout was decisive, it could result in the market retesting the July high at 15,931. First, however, the market needs to clear any potential supply at 15 628.
Line-On-Close Chart Analysis
If we do our Nasdaq technical analysis using a Line-On-Close (LOC) chart, we can see that the market has actually created a double bottom around 14,680. In the weekly chart, this is reflected as long wicks below the candle bodies. LOC analysis suggests the market is still quite bullish and could resolve the ongoing consolidation to the upside.
Weekly Chart Indicators
The indicators in the weekly chart are still quite bullish. The fast SMA(20) is above the SMA(50) and both averages are pointing higher. The stochastic oscillator has also created a higher low (bullish divergence) indicating momentum loss on the downside. This indication reflects the market creating two rejection candles at 14,904.
Comparative Strength of Nasdaq
As per our Nasdaq technical analysis, the index has been stronger than the other indices. This would be supportive of a bullish view of the index but only if the other indices do not sell off substantially or start to recover. Note that relatively strong markets tend to be the first to attract buyers when the other correlated markets begin to recover after a reaction lower.
Bearish Perspective
A more bearish take on Nasdaq technical analysis would indicate that the market is creating a top. The lower weekly swing high put in place in August could mean that institutional investors are distributing their holdings and therefore the topping formation could be resolved to the downside.
Potential Market Reactions
And, indeed, if all the other markets decline substantially it is quite possible that Nasdaq will follow suit. Nasdaq technical analysis indicates that a decisive break below the September low at 14,904 could bring the 13,722 market structure level into play. This level is closely aligned with the 38.2% Fibonacci level and the bearish trend channel low.
Daily Nasdaq Technical Analysis
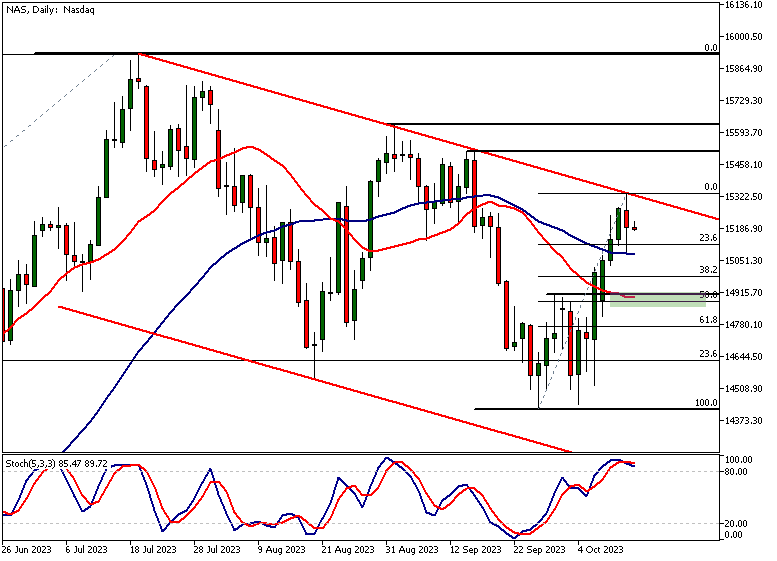
The daily chart reveals how the index reacted to the SMA(50) and created the daily low right at the SMA (at 15,087). This makes the level a key support for today's intraday traders. If the level is defended, look for further strength in the index.
Bearish Scenario and Confluence Area
However, should the bears be able to push the market below the level, we might see the market moving down to the next confluence area at 14,874 - 14,904. The area consists of the 50% Fibonacci retracement level, the SMA(20) and a market structure level.
If the weakness that started in the other main indices yesterday (the DJIA, the S&P 500 and the DAX) continues today and Monday, Nasdaq technical analysis suggests a move to the confluence area might well happen.
Price Action and Resistance Levels
Note though that this, as always, is subject to the unfolding price action. Alternatively, if the market can push above the 15,336 high and maintain the levels above the high the next resistance levels at 15,512 and 15,628 could come into play.
Indicator-based Analysis
Indicator-based Nasdaq technical analysis suggests the market is overbought. The Stochastic oscillator is above 80 and has given a sell signal following the downday yesterday.
Note that indicators follow the price, not the other way around. The moving averages point lower with the fast SMA(20) below the slow SMA(50) reflecting the weakness in the market (lower swing highs).
Nasdaq Technical Analysis, 4h
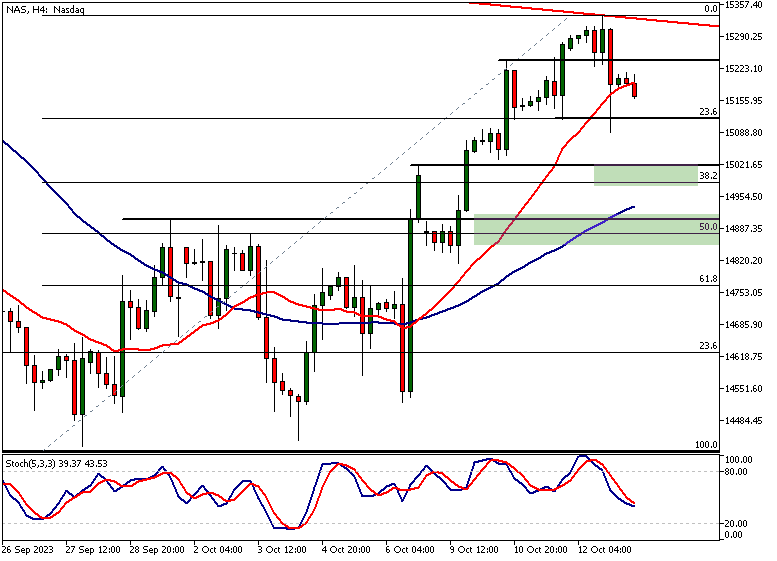
In the four-hour chart, Nasdaq is still in an uptrend but it has broken below a key market structure level (15,241). This break resulted in a strong momentum candle to the downside. The next market structure level at 15,116 was also penetrated but the market recovered and is now trading near the SMA(20).
Lower Swing High Implication
A lower swing high below yesterday's high would increase the probability of the corrective move continuing. If the SMA(50) identified in the daily Nasdaq technical analysis (at yesterday's low) doesn't hold, look for a move down to the next technical confluence area (at 14,980 - 15,021) around the 38.2% Fibonacci retracement level.
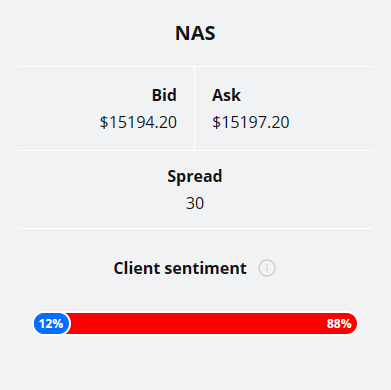
Almost 90% of TIOmarkets' retail traders are bearish on Nasdaq. Only 12% are currently holding long positions.
It’s good to remember that the retail trader client sentiment is a contrarian indicator as most of the retail traders are on average betting against the market trends. This is why, experienced traders tend to trade against the retail client sentiment. You can follow the TIOmarkets client sentiment live on our Forex dashboard.
The key takeaways from this report
- Nasdaq has encountered resistance at 15,336, aligning with the 61.8% Fibonacci retracement level and the bearish trend channel high. A decisive breach could open doors to retesting the July high at 15,931. Fast SMA(20) is above SMA(50), suggesting a bullish outlook.
- The latest swing low for Nasdaq is at 14,429, resulting in bullish rejection candles. Overcoming potential supply at 15,628 is crucial for an upside breakout from the bearish trend channel. Stochastic oscillator indicates momentum loss on the downside, further supporting a bullish scenario.
- A Line-On-Close (LOC) chart reveals a double bottom pattern around 14,680, suggesting bullish possibilities for Nasdaq. Both SMA(20) and SMA(50) are pointed upwards, bolstering the case for a potential bullish resolution.
- Daily chart indicates key support at SMA(50) level of 15,087 for intraday traders. A bearish push below this could drive Nasdaq towards the next confluence area at 14,874 - 14,904, which involves the 50% Fibonacci level and SMA(20).
- Indicators suggest Nasdaq is overbought, with the Stochastic oscillator exceeding 80 and showing a sell signal. Fast SMA(20) is below slow SMA(50), indicating short-term bearishness that could drive the market towards lower levels.
- On a four-hour chart, Nasdaq has broken a key market structure at 15,241. Should SMA(50) not hold, anticipate a downward move to the 14,980 - 15,021 zone, around the 38.2% Fibonacci level, signalling a possible continuation of the corrective phase.
Read more analysis on US equity indices
Nasdaq
Dow Jones Industrial Average

The next main risk events
- EUR - ECB President Lagarde Speaks
- USD - FOMC Member Harker Speaks
- USD - Prelim UoM Consumer Sentiment
- USD - Prelim UoM Inflation Expectations
- GBP - BOE Gov Bailey Speaks
- EUR - ECB President Lagarde Speaks
For more information and details see the TIOmarkets economic calendar.
While research has been undertaken to compile the above content, it remains an informational and educational piece only. None of the content provided constitutes any form of investment advice.
Tio Markets UK Limited is a company registered in England and Wales under company number 06592025 and is authorised and regulated by the Financial Conduct Authority FRN: 488900
Risk warning: CFDs are complex instruments and come with a high risk of losing money rapidly due to leverage. 82% of retail investor accounts lose money when trading CFDs with this provider. You should consider whether you understand how CFDs work and whether you can afford to take the high risk of losing your money. Professional clients can lose more than they deposit. All trading involves risk.
DISCLAIMER: Tio Markets offers an exclusively execution-only service. The views expressed are for information purposes only. None of the content provided constitutes any form of investment advice. The comments are made available purely for educational and marketing purposes and do NOT constitute advice or investment recommendation (and should not be considered as such) and do not in any way constitute an invitation to acquire any financial instrument or product. TIOmarkets and its affiliates and consultants are not liable for any damages that may be caused by individual comments or statements by TIOmarkets analysis and assumes no liability with respect to the completeness and correctness of the content presented. The investor is solely responsible for the risk of his/her investment decisions. The analyses and comments presented do not include any consideration of your personal investment objectives, financial circumstances, or needs. The content has not been prepared in accordance with any legal requirements for financial analysis and must, therefore, be viewed by the reader as marketing information. TIOmarkets prohibits duplication or publication without explicit approval.

Janne Muta holds an M.Sc in finance and has over 20 years experience in analysing and trading the financial markets.
