Risk disclaimer: 76% of retail investor accounts lose money when trading CFDs and Spreadbets with this provider. You should consider whether you understand how CFDs and Spreadbets work and whether you can afford to take the high risk of losing your money.
S P 500 technical analysis | A key price level broken ahead of Powell's speech
BY Janne Muta
|October 2, 2023S P 500 technical analysis - This comprehensive analysis provides traders with a multi-timeframe view of the S&P 500 Index, examining the weekly, daily, and 4-hour charts.
Key Price Levels
The market currently shows a mix of bearish and bullish signals, with significant price levels identified at 4336, 4216, and 4540. Key upcoming economic indicators, including Federal Reserve Chair Powell's speech and the release of U.S. PMI numbers, are likely to exert considerable influence on market direction.
Impact of Bond Yields on Equities
Long-term government bond yields are rising and the Federal Reserve has adopted a cautious stance on interest rates, affecting the stock market and particularly technology shares. As a result, investors are increasingly looking at fixed-income options as a less risky alternative.
Recession Risk Assessment
Concurrently, Deutsche Bank has flagged a 30% risk of a U.S. recession within the next year, citing a rapid rise in interest rates and falling corporate profits among their concerns.
Bullish Outlook
In contrast, Goldman Sachs has offered a bullish perspective, highlighting the S&P 500's historical resilience and its average 21% rise in the two years following a peak in consumer-price inflation.
The next key risk events for S&P 500 are the Fed Chair Powell's Speech and the US Manufacturing PMI release.
Read the full S P 500 technical analysis report below.
S P 500 technical analysis
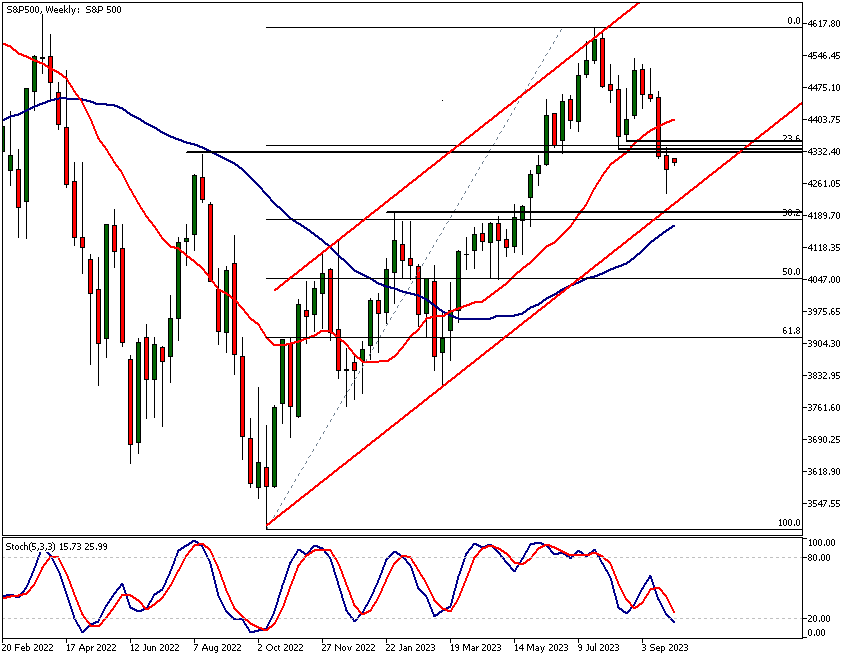
Weekly S P 500 Technical Analysis
The S&P 500 Index has created a lower reactionary high on the weekly chart at 4540. Additionally, the market has broken below a key support level at 4336 and is trading just below this level at the time of writing this report.
Upcoming Economic Indicators and Market Sentiment
With Federal Reserve Chair Powell's speech scheduled for today, along with the release of the US PMI numbers, the ensuing price action is critical. This could establish the market sentiment for both intraday and swing traders for several days.
Utility of This Analysis for Future Trading Decisions
The insights gained from this report can form the basis for more advanced S P 500 technical analysis, aiding traders in identifying market trends and volatility.
Technical Indicators Signalling Possible Downside
Despite the market remaining within an ascending price channel and the moving averages pointing upwards, the creation of a lower reactionary high on the weekly chart significantly increases the risk of further downside in the weeks ahead.
Scenarios Based on Key Resistance and Support Levels
If the Index fails to sustain levels above the 4336 key resistance level, our S P 500 technical analysis suggests it could fall below the bullish trend channel's low, which currently stands at 4216. The next major support level below the current market price is at 4195.
Bullish Potential and External Factors
Alternatively, if bulls manage to push the market above 4336 and sustain this momentum, the market could challenge the 4540 high. Last week's price candle features a long wick, suggesting that bulls are attempting to push the market above the confluence area formed by the 4336 resistance level and the 23.6% Fibonacci retracement level.
Success in this endeavour is contingent on Chair Powell's upcoming remarks and the market's overall reaction to it.
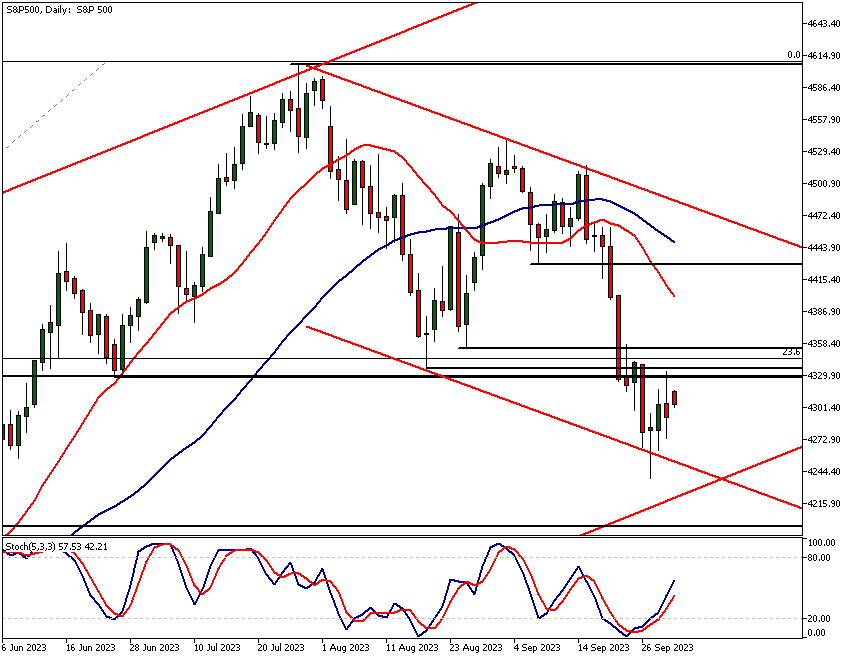
Daily S P 500 Technical Analysis
The daily chart indicates that the S&P 500 Index is within a bearish trend channel. This channel low inspired buying activity last Wednesday. Subsequently, the stochastic oscillator has signalled a buy on the daily timeframe and is pointing upwards.
Signs of Rally Weakness in Recent Trading Sessions
However, the rally is showing signs of weakness. Friday's trading session ended with the market closing below its daily open, resulting in a bearish candle with a long shadow above its body.
Importance of Upcoming Economic Data for Market Direction
With the stochastic oscillator signalling a buy yet the market showing signs of rally exhaustion, attention to today's Federal Reserve announcements and ISM Manufacturing PMI data is absolutely crucial.
The Utility of Technical Analysis in Short-Term Trading
S P 500 technical analysis can offer real-time insights that are invaluable for short-term trading, making it a crucial tool in a trader's arsenal.
Key Price Ranges and Resistance Levels in Focus
The price range between 4328 and 4355 is evidently a significant area closely monitored by institutional traders. The channel analysis suggests a lower probability for bullish moves. Our S P technical analysis suggests that even if bulls manage to push the market above this resistance range, a significant hurdle awaits at the 4429 resistance level. The 20-period moving average is at 4399, while the 50-period is at 4448, offering additional layers of resistance.
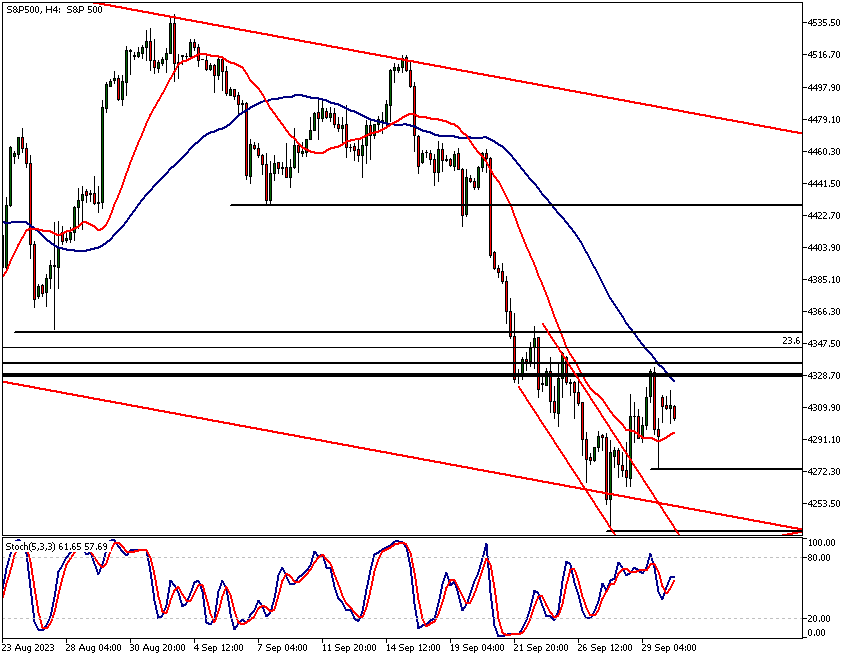
4-hour S P 500 Technical Analysis
The 4-hour chart largely mirrors the daily chart. After breaking out of a minor bearish trend channel on the 28th, the market tested the confluence area identified in the daily chart's S&P 500 analysis. Since then, the market has dropped to create a higher low at 4274.
Stochastic Oscillator and Market Reaction
The stochastic oscillator signalled a sell after reaching the 80 level, prompting the market to react lower. If bulls can sustain levels above 4274, there could be another push towards the confluence area at 4328-4355.
Potential Scenarios and Key Resistance Zones
Should they manage to push through this area, the next key 4-hour resistance zone lies between 4417 and 4458. However, at the time of writing, the market is struggling to breach this confluence area, and the moving averages are pointing lower. Therefore, our S P 500 technical analysis indicates that if the market fails to break above this area, it could decline to last week's lows around 4038.
Fed Chair Powell's Speech today
Today's speech by Fed Chair Powell and the ISM Manufacturing PMI data could serve as a catalyst for either breaking above the confluence area at 4328-4355 or for a move downward to last week's lows around 4038.
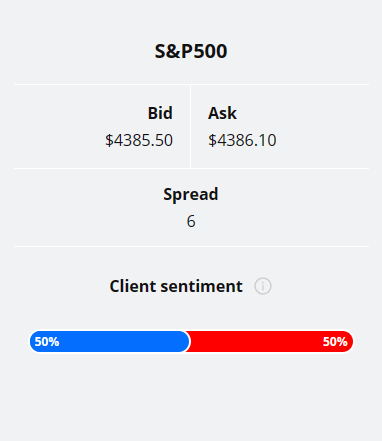
Client sentiment analysis
TIOmarkets' clients are positioned exactly evenly in the S&P 500 (50%/50%). There is therefore no indication to either direction on client sentiment in this market.
It’s good to remember that the retail trader client sentiment is a contrarian indicator as most of the retail traders are on average betting against the market trends. This is why, experienced traders tend to trade against the retail client sentiment. You can follow the TIOmarkets client sentiment live on our Forex dashboard.
S&P 500 fundamental analysis
The financial markets are marked by both optimism and caution, driven by conflicting economic indicators and varied forecasts from leading financial institutions. On one hand, rising yields on long-term government bonds and a cautious stance from the Federal Reserve on interest rates have tempered the stock market's earlier gains.
Recalibration in the Technology Sector
This shift has particularly affected technology shares, leading to a recalibration of investment strategies. Fixed-income options are increasingly becoming attractive as investors seek less risky alternatives to equities in a higher interest rate environment.
Understanding the broader economic landscape through fundamentals is useful, but S P 500 technical analysis can capture market sentiment that may not yet be reflected in economic data.
Deutsche Bank's Warning
On the other hand, Deutsche Bank economists have warned of a high risk of recession in the U.S., pegging the probability at 30% within the next 12 months. They cite four indicators, such as a rapid rise in interest rates and declining corporate profits, as red flags.
Contrasting Views from Goldman Sachs
These cautionary signals are driving some investors towards more conservative investment strategies. However, Goldman Sachs as reported by WSJ.com provides a contrasting, bullish view, underlining the historical resilience of markets even during economic turbulence.
According to Goldman Sachs, the S&P 500 has on average risen 21% in the two years following a peak in consumer-price inflation.
Investor Adaptability
Investors and traders therefore have to weigh the risk of a slowdown or recession against the potential for market resilience. As we start the final quarter of 2023, caution and adaptability are likely to be the guiding principles for investors, given the conflicting economic signals and forecasts. This could create trading opportunities on the short side of the market.
Risk diversification and agile asset allocation will likely be crucial in the months ahead, as market participants balance the potential risks and rewards of an uncertain environment. In summary, S P 500 technical analysis serves as an indispensable tool for traders looking to navigate the frequent shifts in market dynamics, separate from the underlying fundamental indicators.
The key takeaways from this report
- The weekly chart shows a lower reactionary high at 4540, indicating an increased risk of further downside. Market broke key support at 4336, now acting as resistance.
- On the daily chart, S&P 500 is trading within a bearish trend channel. Stochastic oscillator signalled a buy but the market shows signs of rally fatigue.
- The 4-hour chart mirrors the daily. It broke out of a minor bearish channel on 28th but struggles to surpass the 4328-4355 resistance zone. Next key resistance lies between 4417 and 4458.
- TIOmarkets' client sentiment shows a 50/50 split, typically a contrarian indicator. Experienced traders often bet against retail sentiment.
- Deutsche Bank warns of a 30% recession risk due to rising interest rates and declining corporate profits. Contrarily, Goldman Sachs forecasts resilience, expecting a 21% rise in S&P 500 post-peak inflation.
- The financial markets are driven by both optimism and caution. Rising yields on long-term government bonds and uncertainty about interest rates temper the stock market's gains, particularly affecting the technology sector.
Read more analysis on S&P 500 and the US economy
Read more analysis on US economy

The Next Main Risk Events
- USD - ISM Manufacturing PMI
- USD - ISM Manufacturing Prices
- USD - Fed Chair Powell Speaks
- USD - FOMC Member Harker Speaks
- AUD - Cash Rate
- AUD - RBA Rate Statement
- CHF - CPI m/m
- USD - JOLTS Job Openings
- NZD - Official Cash Rate
- NZD - RBNZ Rate Statement
- EUR - ECB President Lagarde Speaks
- USOIL - OPEC-JMMC Meetings
- USD - ADP Non-Farm Employment Change
- USD - ISM Services PMI
- EUR - ECB President Lagarde Speaks
- GBP - Construction PMI
- USD - Unemployment Claims
- CAD - Ivey PMI
- CHF - Foreign Currency Reserves
- CAD - Employment Change
- CAD - Unemployment Rate
- USD - Average Hourly Earnings m/m
- USD - Non-Farm Employment Change
- USD - Unemployment Rate
- USD - FOMC Member Waller Speaks
For more information and details see the TIOmarkets economic calendar.
While research has been undertaken to compile the above content, it remains an informational and educational piece only. None of the content provided constitutes any form of investment advice.
Tio Markets UK Limited is a company registered in England and Wales under company number 06592025 and is authorised and regulated by the Financial Conduct Authority FRN: 488900
Risk warning: CFDs are complex instruments and come with a high risk of losing money rapidly due to leverage. 82% of retail investor accounts lose money when trading CFDs with this provider. You should consider whether you understand how CFDs work and whether you can afford to take the high risk of losing your money. Professional clients can lose more than they deposit. All trading involves risk.
DISCLAIMER: Tio Markets offers an exclusively execution-only service. The views expressed are for information purposes only. None of the content provided constitutes any form of investment advice. The comments are made available purely for educational and marketing purposes and do NOT constitute advice or investment recommendation (and should not be considered as such) and do not in any way constitute an invitation to acquire any financial instrument or product. TIOmarkets and its affiliates and consultants are not liable for any damages that may be caused by individual comments or statements by TIOmarkets analysis and assumes no liability with respect to the completeness and correctness of the content presented. The investor is solely responsible for the risk of his/her investment decisions. The analyses and comments presented do not include any consideration of your personal investment objectives, financial circumstances, or needs. The content has not been prepared in accordance with any legal requirements for financial analysis and must, therefore, be viewed by the reader as marketing information. TIOmarkets prohibits duplication or publication without explicit approval.

Janne Muta holds an M.Sc in finance and has over 20 years experience in analysing and trading the financial markets.
