Risk disclaimer: 76% of retail investor accounts lose money when trading CFDs and Spreadbets with this provider. You should consider whether you understand how CFDs and Spreadbets work and whether you can afford to take the high risk of losing your money.
GBPAUD analysis | GBPAUD rallies from a key confluence area
BY Janne Muta
|October 6, 2023Our GBPAUD analysis reveals a strong rally over the past week, following a sharp correction from the August high. The market attracted buyers as it moved to the 38.2% Fibonacci retracement level, with a healthy rally ensuing from last week's low.
Potential Buy Signal
The stochastic oscillator's movement into the oversold territory and its potential crossing above the signal line could act as a precursor to a buy signal. However, the current value of 14.95 necessitates a cautious approach and a thorough review of the entire GBPAUD analysis report before any trading action is taken.
Moving Averages
The divergence in the 20 and 50-period moving averages between the 4-hour chart and longer timeframe charts signifies a disparity in momentum which could affect today's trading outlook. Trading below the 20-period moving average on the longer timeframe charts for the first time since February poses a warning signal to traders.
Break from the Bullish Trend Channel
The market's fall below the previously established bullish trend channel is a significant event that could potentially alter the bullish outlook. Despite some bullish indicators, the necessity for cautious trading and the requisite for price action confirmation from lower timeframe charts is emphasised. We believe that our GBPAUD analysis report below will help traders to do this.
The GBPAUD analysis report, key takeaways:
- The weekly GBPAUD analysis reveals a crucial resistance level at 1.9460, where minor weekly resistance aligns with the ascending Trend Channel low, suggesting a potential level for profit-taking.
- The stochastic oscillator in the GBPAUD pair is nearing a Buy Signal as it crosses above its signal line in the oversold area, with a current value of 14.95, indicating possible bullish momentum.
- For the first time since February, the GBPAUD market is trading below the 20-period moving average, although both 20 and 50 period moving averages are pointing higher, signifying upward momentum.
- In the daily chart, a double bottom formation with a low created in July, coupled with the recent market rally of about 2% from last week's low, hints at a possible consolidation or upward push.
- A close examination of the 4-hour chart unveils two confluence areas at 1.9040 - 1.9061 and 1.8980 - 1.8997 ranges, including a Fibonacci retracement level and market structure level, indicating potential pivot points.
- The 1.8858 low in GBPAUD represents a critical level; a decisive break below could potentially steer the market towards the next significant support level at 1.8500, as shown in our GBPAUD analysis.
The next key risk events for GBPAUD
- AUD - BRC Retail Sales Monitor
- AUD - Westpac Consumer Confidence Index
- AUD - NAB Business Confidence
- GBP - UK GPD
Read the full GBPAUD analysis report below.
GBPAUD analysis
This comprehensive GBPAUD analysis focuses on the GBPAUD currency pair using multi timeframe analysis as well as examines the fundamental landscapes in both the UK and Australia.
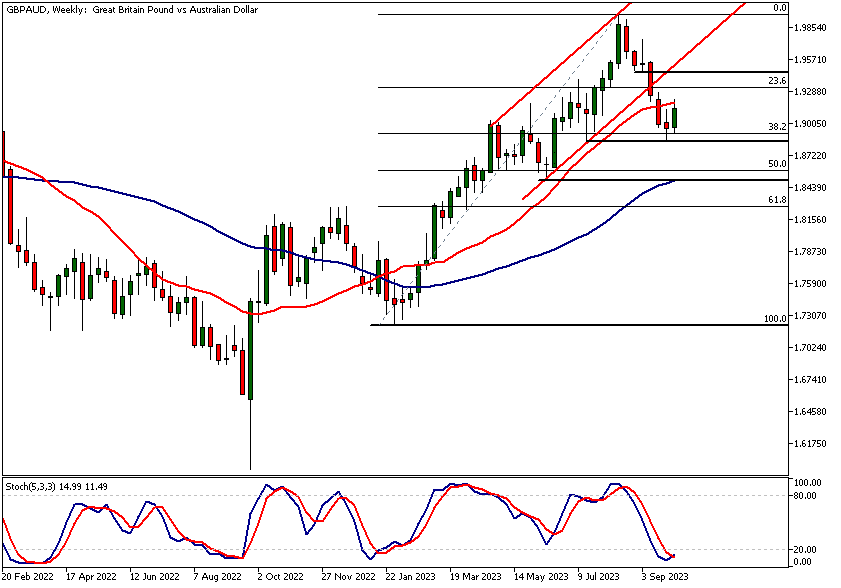
GBPAUD analysis, weekly chart
The GBPAUD currency pair has gained some ground this week. The market corrected sharply lower from the August High (5.56%) and started to attract buyers near the 38.2% Fibonacci retracement level last week.
Stochastic Oscillator Insight
The rally from last week's low has been healthy with the market gaining over 1.8%. As a result, the stochastic oscillator is about to give a Buy Signal with the oscillator crossing above its signal line while the indicator is still in the oversold area (below 20). The current value for the stochastic oscillator is 14.95. However, please read the full GBPAUD analysis report before acting upon this indication.
Moving Averages Analysis
Both 20 and 50 period moving averages are pointing higher, thus indicating upward momentum. However, for the first time since February this year, the market is trading below the 20-period moving average. Also, the market is now trading well below the bullish Trend Channel it broke out of 3 weeks ago.
Weekly Chart Analysis
With both bullish signs and signs of weakness in the market, traders need to be cautious and look for price action confirmation using the lower timeframe charts. In the weekly chart, we need to apply GBPAUD analysis and see a continuation of this week's bullish move.
Resistance and Support Levels
The market needs to push above 1.9191 and maintain the bullish momentum above this level. This would possibly pave the way to 1.9460 or so, where a minor weekly resistance level coincides with the ascending Trend Channel low. The combination of these two technical factors makes 1.9460 a potential level for profit taking.
Alternative Market Movements
Alternatively, if the bulls cannot keep the momentum going and the market fails to penetrate the 20-period moving average, we should look for a retest of last week's low at 1.8858. Our GBPAUD analysis shows the next significant support level below this reactionary low is at 1.8500. A decisive break below 1.8858 could potentially move the market down to this key support level.
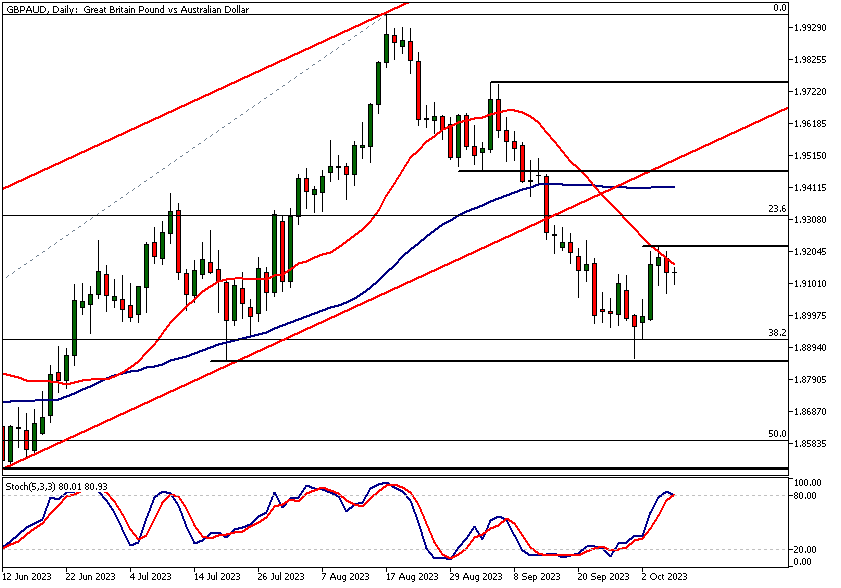
GBPAUD analysis, daily chart
The daily chart reveals how the market has lost momentum over the last 2 days. This has resulted in the stochastic oscillator turning lower after it moved above the 80 level. The indicator is about to give a Sell Signal if the weakness in the market continues.
Double Bottom Formation
The 20-period moving average acted as resistance after the market had rallied about 2% from last week's low. This low, together with a low created in July, has formed a double bottom in the GBPAUD pair. As per our GBPAUD analysis, the market isn't so likely to continue trading lower after this double bottom.
Market Consolidation and Uprising
This leaves us with two options: either the market will consolidate above the 1.8858 low, or bulls will be able to push the market further up. In other words, our GBPAUD analysis points to the current price action being highly critical. It could set the tone for both intraday and swing trading for several days (and perhaps even weeks) to come.
Resistance Levels on Daily Chart
The nearest resistance level in the daily chart is evidently at 1.9221. A decisive break above this level would open the way to the next technical confluence zone between 1.9409 and 1.9464. This technical confluence area is created by a market structure level and the 50-period moving average.
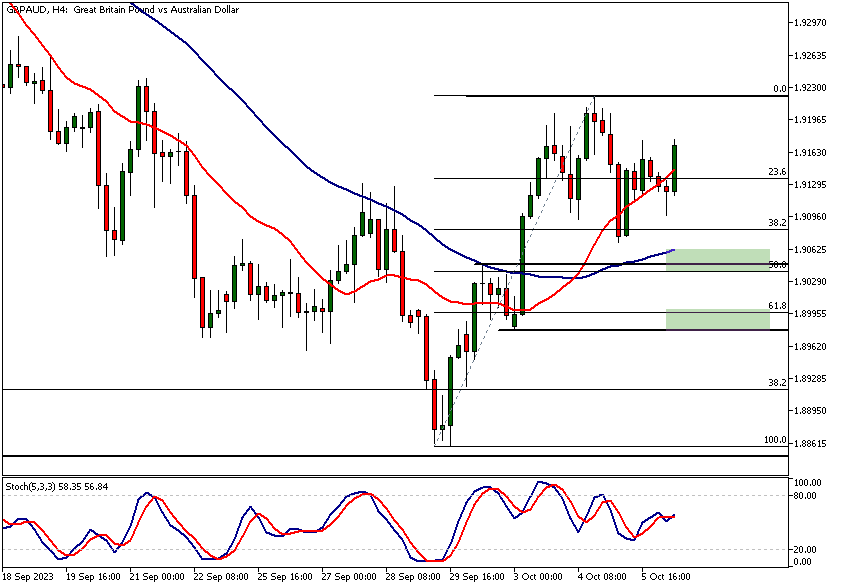
GBPAUD analysis, 4h chart
The 4-hour chart has two confluence areas. The nearest to the current market price is at the 1.9040 - 1.9061 range and the lower area at 1.8980 - 1.8997. Both areas include a Fibonacci retracement level and a market structure level, while the upper zone also includes the 50-period SMA.
Upward Market Pressure
The 4-hour chart also shows the market creating higher swing lows with the moving averages pointing higher. The indication is that there is upward pressure in the market at the time of writing this report. The moving averages in our GBPAUD analysis indicates bullishness. The fast SMA(20) is above the slow SMA(50), further suggesting the market has an upward bias.
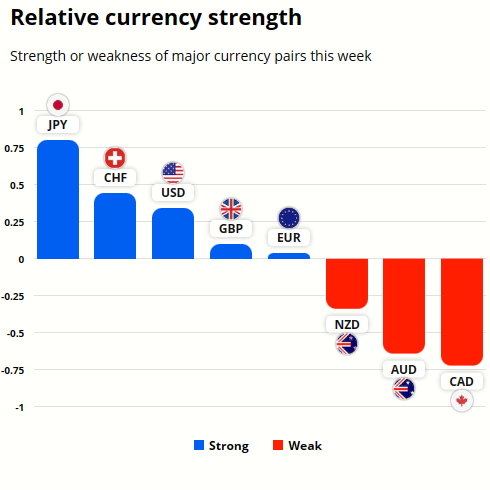
GBP and AUD currency strength analysis
This week GBP has been relatively strong compared to AUD which is currently the second weakest currency after CAD. The JPY has been the strongest, possibly driven higher by safe haven inflows.
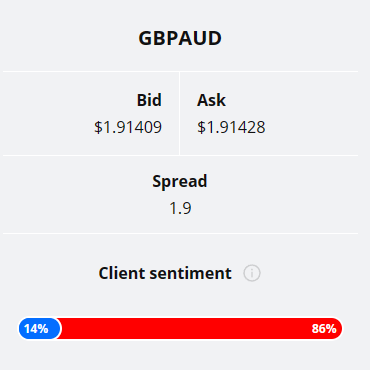
Vast majority of TIOmarkets' clients (86%) are bearish on the GBPAUD pair. Only 14% of the client base are holding long positions.
Please remember that the retail trader client sentiment is a contrarian indicator as most of the retail traders are on average betting against the market trends. This is why, experienced traders tend to trade against the retail client sentiment. You can follow the TIOmarkets client sentiment live on our Forex dashboard.
Read our previous GBPAUD analysis

The next main risk events
- CAD - Employment Change
- CAD - Unemployment Rate
- USD - Average Hourly Earnings m/m
- USD - Non-Farm Employment Change
- USD - Unemployment Rate
- USD - FOMC Member Waller Speaks
For more information and details see the TIOmarkets economic calendar.
While research has been undertaken to compile the above content, it remains an informational and educational piece only. None of the content provided constitutes any form of investment advice.
Tio Markets UK Limited is a company registered in England and Wales under company number 06592025 and is authorised and regulated by the Financial Conduct Authority FRN: 488900
Risk warning: CFDs are complex instruments and come with a high risk of losing money rapidly due to leverage. 82% of retail investor accounts lose money when trading CFDs with this provider. You should consider whether you understand how CFDs work and whether you can afford to take the high risk of losing your money. Professional clients can lose more than they deposit. All trading involves risk.
DISCLAIMER: Tio Markets offers an exclusively execution-only service. The views expressed are for information purposes only. None of the content provided constitutes any form of investment advice. The comments are made available purely for educational and marketing purposes and do NOT constitute advice or investment recommendation (and should not be considered as such) and do not in any way constitute an invitation to acquire any financial instrument or product. TIOmarkets and its affiliates and consultants are not liable for any damages that may be caused by individual comments or statements by TIOmarkets analysis and assumes no liability with respect to the completeness and correctness of the content presented. The investor is solely responsible for the risk of his/her investment decisions. The analyses and comments presented do not include any consideration of your personal investment objectives, financial circumstances, or needs. The content has not been prepared in accordance with any legal requirements for financial analysis and must, therefore, be viewed by the reader as marketing information. TIOmarkets prohibits duplication or publication without explicit approval.

Janne Muta holds an M.Sc in finance and has over 20 years experience in analysing and trading the financial markets.
