Risk disclaimer: 76% of retail investor accounts lose money when trading CFDs and Spreadbets with this provider. You should consider whether you understand how CFDs and Spreadbets work and whether you can afford to take the high risk of losing your money.
AUDCAD | AUDCAD rallies ahead of today's Canada GDP
BY Janne Muta
|September 29, 2023The AUDCAD analysis shows the currency pair at a critical juncture, with price action patterns that could be indicative of broader market trend change. Over the past two days, the currency pair has rallied by an impressive 1.6%, signaling potential for a bullish reversal.
Bullish & Bearish Technical Indicators
The formation of what traders identify as a "hammer" or "exhaustion" candle could be forming on the weekly chart. Another bullish indication is the bullish divergence in the stochastic oscillator.
The currency pair, however, remains within a bearish weekly price channel with the 20-period moving average still pointing to the downside.
Inflation Concerns
Both Australia and Canada are wrestling with rising inflation rates that are higher than their respective central banks' targets. Canada's inflation rate has reached 4%, compelling the Bank of Canada (BoC) to consider tightening monetary policy further.
Meanwhile, Australia's Consumer Price Index (CPI) rose to 5.2%, leaving the Reserve Bank of Australia (RBA) in a similar policy conundrum. We hope that our AUDCAD analysis below will help you to plan your trades with a higher accuracy.
Upcoming High-Impact Events
The upcoming GDP release from Canada today is another high-impact event that traders are keenly watching, as it could serve as a catalyst for significant price movement.
The GDP data, coupled with the central banks' responses to inflation, could impact not only intraday trading but also set the tone for medium-term market sentiment.
The AUDCAD analysis report, key takeaways:
- AUDCAD has rallied 1.6% in two days, hinting at a bullish weekly candle formation, either a "hammer" or an "exhaustion candle," suggesting potential for a bullish market reversal.
- Despite bullish momentum, the market remains within a bearish weekly price channel and below the 20-period moving average, indicative of a prevailing downward trend.
- The daily chart shows a bullish momentum candle, and the stochastic oscillator issued a buy signal, indicating a strong upward movement in the short term.
- Key resistance and support levels are defined by Fibonacci retracements, with a significant confluence zone centred around the 23.6% level, between 0.8760 and 0.8826.
- Canada and Australia's economic fundamentals include rising inflation and subdued growth, influencing central banks' monetary policies and adding complexity to AUDCAD trading.
- The CAD swap market indicates bets on the BoC hiking rates by year-end, but negative GDP growth could depreciate the currency, influencing AUDCAD market dynamics.
The next key risk events for AUDCAD are
- Canada GDP
- China Manufacturing PMI
- China Non-Manufacturing PMI
- RBA Rate Decision
Read the full AUDCAD analysis report below.
AUDCAD analysis
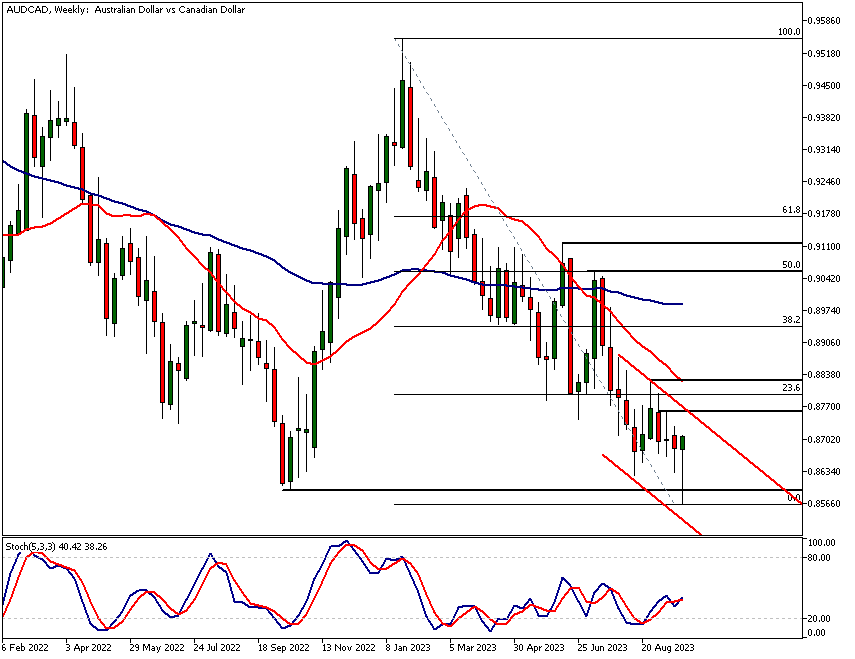
AUDCAD analysis, weekly chart
The AUDCAD currency pair has rallied by over 1.6% in a mere two days. This rise suggests the market is likely to form a bullish weekly candle, known among traders either as a "hammer formation" or an "exhaustion candle."
Initial Market Movement and Subsequent Reversal
From an AUDCAD analysis viewpoint, it is notable that although the market initially moves lower after opening, this downward trajectory is subsequently negated.
The candle then closes at the upper end of its range. Should today's close surpass 0.8679, the weekly candle will close above its opening price, underlining the bullish momentum observed over the past two days.
Contradictory Bearish Indicators
Despite this bullish activity, the market continues to trade within a bearish weekly price channel. Additionally, the 20-period moving average is indicating a downward trend, with the current trading price falling below this average.
Stochastic Oscillator and the Potential for Market Reversal
However, our AUDCAD analysis suggests the robust price action over the last two days implies a potential for a major market reversal. This notion is further supported by a bullish divergence signal from the stochastic oscillator, which has formed a higher low even as the market has registered a lower reactionary low this week.
Market Expectations Based on Weekly Closing Price
If today's close is indeed above the weekly opening price, the market is expected to trade higher next week. In that scenario, it becomes probable that the technical confluence zone centred around the 23.6% Fibonacci retracement level could be tested.
Confluence Area and Future Trajectories
This confluence area, defined by the upper boundary of the bearish price channel, a weekly high, and the 20-period moving average, lies between 0.8760 and 0.8826. Conversely, AUDCAD analysis suggests that if the market fails to maintain its recent upward trajectory, a retest of this week's low of 0.8564 should be anticipated.
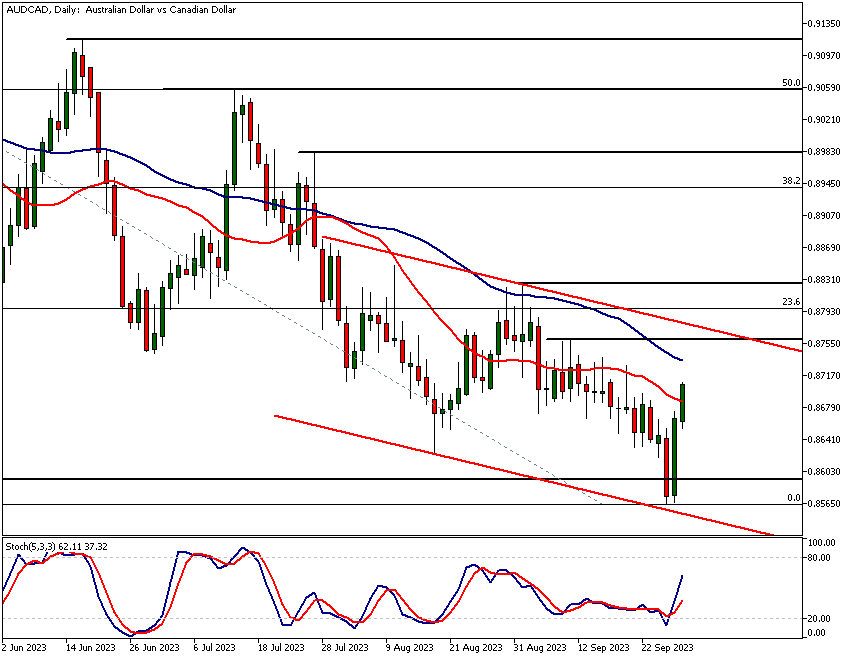
AUDCAD analysis, daily chart
The daily chart shows the intensity of the current rally. Yesterday's daily price candle manifested as a bullish momentum candle, and today the market has also rallied strongly. As a consequence, the stochastic oscillator is pointing sharply higher after issuing a buy signal yesterday.
Positioning of Moving Averages
The market is presently oscillating between the 20-period and 50-period moving averages. These moving averages are in a bearish configuration, with the 20-period average situated below the 50-period average.
Significance of Today's Price Action
From the perspective of AUDCAD analysis, today's price action is pivotal and could alter market sentiment for not just the immediate future, but potentially for several weeks.
Should we witness another strong close today, the likelihood of the market challenging and breaching the technical confluence zone - identified as between 0.8760 and 0.8826 in the aforementioned weekly AUDCAD analysis - increases.
Fibonacci Levels and Beyond
In the event that the market surpasses this confluence zone, a move toward the 38.2% Fibonacci retracement level becomes more plausible. The subsequent key resistance level above this Fibonacci mark is a reactionary high at 0.8980.
Another Significant Technical Confluence Area
Another significant technical confluence area lies between 0.9056 and 0.9117. This zone is outlined by two market structure levels and the 50% Fibonacci retracement level, which coincides with the reactionary high at 0.9056.
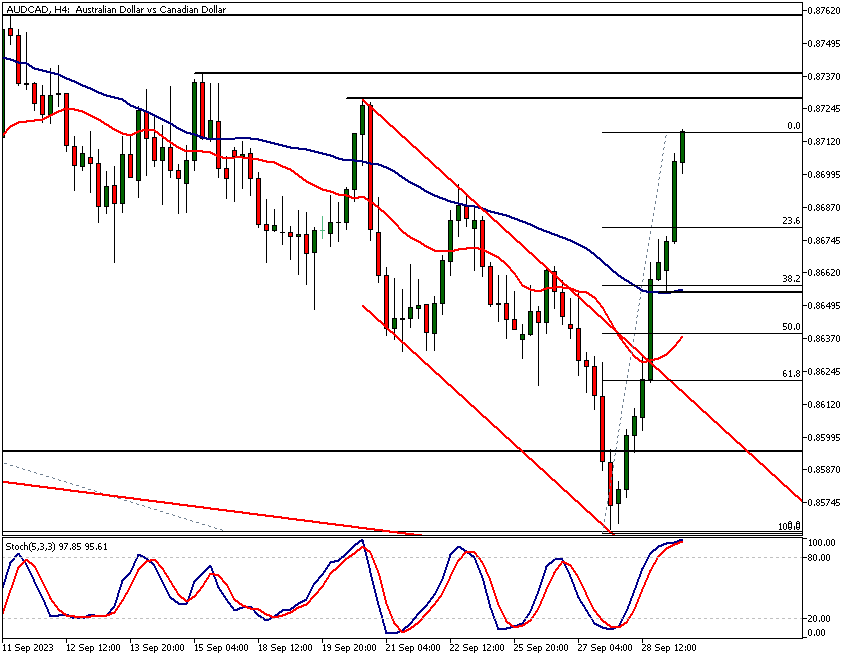
AUDCAD analysis, 4h chart
The 4-hour chart also highlights the strength of the rally, propelling the market above the high of the bearish trend channel. As per our AUDCAD analysis, the strength of this bullish breakout suggests that a considerable inflow of new capital is entering the market. This could provide further strength for the AUDCAD pair.
Stochastic Oscillator and Overbought Status
The stochastic oscillator has ascended well above the 80 level. It should be noted, however, that the market is no longer trending downward within the 4-hour trend channel. Consequently, the overbought status indicated by the stochastic oscillator is not really important.
Misconceptions about Overbought Indicators
Novice traders might mistakenly believe that an overbought indicator necessitates a selling position. An oscillator in an overbought area, however, isn't a reason to sell the market. The price action itself is the key as the oscillator will follow what the price does. Therefore proper AUDCAD analysis should be employed before following any technical indicators.
Support and Resistance Levels on 4-Hour Chart
The nearest support area is created by a confluence area between a 4-hour low at 0.8654, the 50-period SMA and a market structure level at 0.8664. Should this area be tested and fail to hold, the market might move down to the 20-period moving which at the time of writing is at 0.8637. The key resistance levels to watch are 0.8703 and 0.8738.
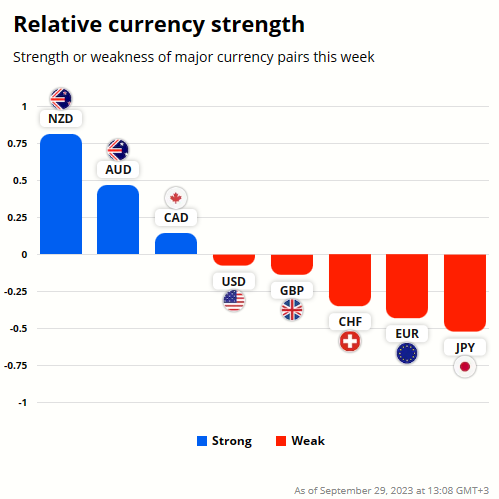
AUD and CAD currency strength analysis
AUDCAD rally over the last two days has turned AUD stronger than CAD for this week. NZD is the strongest currency while the JPY is the weakest.
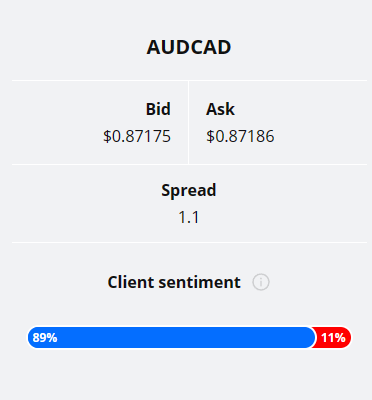
Client sentiment analysis
Most of TIOmarkets' clients (89%) are holding long positions in the AUDCAD currency pair. Read the full AUDCAD analysis report to see how traders should position themselves ahead of the Canadian GDP release today.
Please remember that the retail trader client sentiment is a contrarian indicator as most of the retail traders are on average betting against the market trends. This is why, experienced traders tend to trade against the retail client sentiment. You can follow the TIOmarkets client sentiment live on our Forex dashboard.
AUDCAD fundamental analysis
Both Canada's and Australia's economies are characterised by rising inflation and subdued or negative growth. This presents a policy conundrum for their respective central banks, the Bank of Canada (BoC) and the Reserve Bank of Australia (RBA), as they strive to balance inflation targeting with growth stimulation.
BoC Monetary Policy
Canada's inflation rate reached 4% in August 2023, primarily propelled by transportation and housing costs. This overshoot of the BoC's 2% inflation target may necessitate further monetary tightening, despite the bank recently maintaining its overnight rate at 5%.
RBA Monetary Policy
Meanwhile, the Australian CPI surged to 5.2% in August, with the RBA maintaining a cash rate of 4.1%. Both central banks have left the door open for future rate hikes, contingent on persistent inflationary pressures.
Economic Growth Projections
Economic growth prospects are dim for both economies. Canada's GDP contracted by 0.2% on an annualised basis in Q2 2023, while Australia's Westpac-Melbourne Institute Leading Economic Index signals stagnant activity and projects below 1% growth for the year ending June 2024.
Today's Canada GDP release is highly anticipated and the growth numbers themselves and the consequent market reaction are significant guides for our AUDCAD analysis and trading decisions.
CAD Swap Market and Currency Valuation
Even though the CAD swap market indicates traders betting the BoC will hike the rates by the year-end, negative or stagnant GDP growth could diminish the appeal of Canada's economy to foreign investors. Lacklustre economic performance could prompt a currency depreciation, while robust growth could bolster the currency.

The next main risk events
- CAD GDP
- USD Core PCE Price Index
- USD Chicago PMI
- USD Revised UoM Consumer Sentiment
- USD FOMC Member Williams Speaks
- CNY Manufacturing PMI
- CNY Non-Manufacturing PMI
For more information and details see the TIOmarkets economic calendar.
While research has been undertaken to compile the above content, it remains an informational and educational piece only. None of the content provided constitutes any form of investment advice.
Tio Markets UK Limited is a company registered in England and Wales under company number 06592025 and is authorised and regulated by the Financial Conduct Authority FRN: 488900
Risk warning: CFDs are complex instruments and come with a high risk of losing money rapidly due to leverage. 82% of retail investor accounts lose money when trading CFDs with this provider. You should consider whether you understand how CFDs work and whether you can afford to take the high risk of losing your money. Professional clients can lose more than they deposit. All trading involves risk.
DISCLAIMER: Tio Markets offers an exclusively execution-only service. The views expressed are for information purposes only. None of the content provided constitutes any form of investment advice. The comments are made available purely for educational and marketing purposes and do NOT constitute advice or investment recommendation (and should not be considered as such) and do not in any way constitute an invitation to acquire any financial instrument or product. TIOmarkets and its affiliates and consultants are not liable for any damages that may be caused by individual comments or statements by TIOmarkets analysis and assumes no liability with respect to the completeness and correctness of the content presented. The investor is solely responsible for the risk of his/her investment decisions. The analyses and comments presented do not include any consideration of your personal investment objectives, financial circumstances, or needs. The content has not been prepared in accordance with any legal requirements for financial analysis and must, therefore, be viewed by the reader as marketing information. TIOmarkets prohibits duplication or publication without explicit approval.

Janne Muta holds an M.Sc in finance and has over 20 years experience in analysing and trading the financial markets.
