Risk disclaimer: 76% of retail investor accounts lose money when trading CFDs and Spreadbets with this provider. You should consider whether you understand how CFDs and Spreadbets work and whether you can afford to take the high risk of losing your money.
Silver technical analysis | Silver to rally from key support?
BY Janne Muta
|September 20, 2023Our comprehensive silver technical analysis identifies a sideways trading pattern on the weekly chart, underpinned by reactionary lows that suggest institutional buying each time the market approaches the 22.10 price level. Interestingly, this price range coincides with the 61.8% Fibonacci retracement level, adding further significance to this area.
Weekly Oscillator Indications
The stochastic oscillator on the weekly chart currently hovers near oversold territory, presenting a value of 27.45, which suggests that the market may be ripe for a bullish reversal.
Daily Chart Technical Signals
On the daily chart, silver technical analysis revealed potential bearishness, highlighted by the formation of a bearish shooting star candle. The stochastic oscillator, in this case, is in the overbought zone, and the moving averages are conspicuously flat, indicating a lack of a clear trend direction.
Bullish Signs in the 4-hour Chart
The 4-hour chart, however, offers a bullish perspective. Silver has been trading within a bullish price channel, and the moving averages have aligned in a bullish sequence, lending credence to the possibility of an uptick in prices.
Role of U.S. Dollar and Federal Reserve Decisions
In terms of fundamental factors, the role of the U.S. dollar and the Federal Reserve's interest rate decisions are particularly important. The market is keenly awaiting today's Fed announcement, which is expected to leave rates unchanged. This could weaken the U.S. dollar and might stimulate increased demand for silver.
Geopolitical and Industrial Demand Factors
Additionally, geopolitical tensions, particularly the Russia-Ukraine war in Europe, could create safe-haven buying. This demand along with rising industrial demand from sectors like electric vehicles and solar panels, adds another positive factor to silver's market outlook.
Investor Strategy and Technical Analysis
Given the various bullish and bearish indicators and the influence of external factors, investors and traders should approach the silver market with a keen eye on silver technical analysis.
The key takeaways from this report
- The weekly chart of silver shows a trading range between 22.10 and 25.26. The market has created two higher reactionary lows at 22.21 and 22.29, suggesting institutional buying. These lows coincide with the 61.8% Fibonacci retracement level, increasing their significance.
- Silver's weekly stochastic oscillator stands at 27.45, indicating the market is nearing oversold conditions. Traders should note that the oscillator recently hit a low of 20.16, further highlighting the oversold state, which may set the stage for a bullish reversal.
- On the daily timeframe, silver has formed a bearish shooting star candle. Additionally, the stochastic oscillator value is 83, implying the market is in overbought territory. If silver closes below yesterday's low, it could retest last week's lows.
- The 4-hour chart exhibits a bullish price channel for silver. The fast-moving average is above the slow-moving average, and the stochastic oscillator is close to giving a buy signal. Key resistance stands at 23.42, followed by a market structure level at 23.48.
- Today's Fed rate decision is crucial for the silver market. If rates remain unchanged, the U.S. dollar could soften, making silver more affordable and potentially driving up prices. This is a key timing cue for intraday traders.
- Geopolitical tensions, particularly the Russia-Ukraine conflict, could stimulate safe-haven buying of silver. Rising industrial demand from sectors like electric vehicles and solar panels adds another layer to silver's bullish outlook. Traders should monitor these factors for longer-term price resilience.
The key risk events for silver are the Fed rate decision and the Fed press conference. Read our full silver technical analysis report below.
Silver technical analysis
Weekly Silver technical analysis
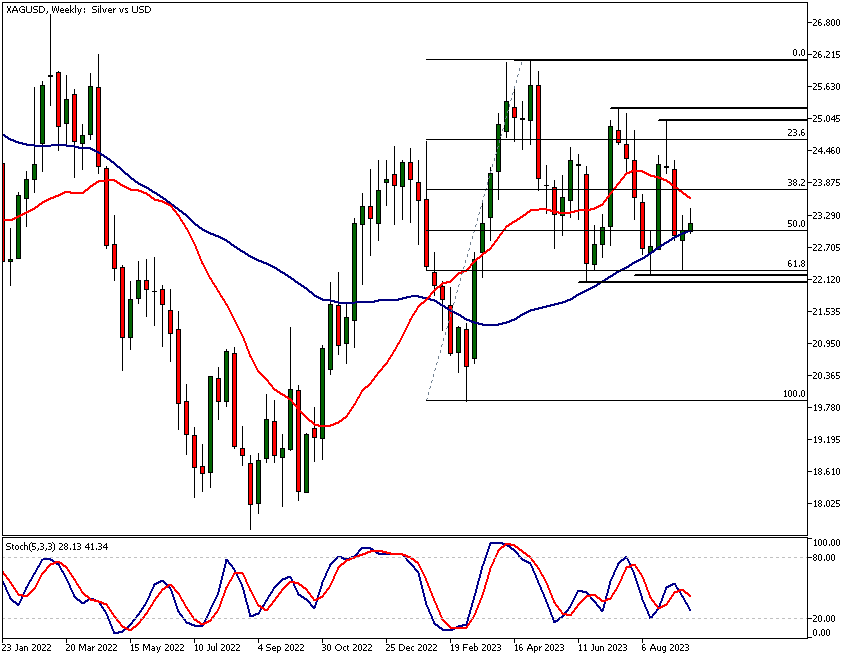
In the weekly chart, silver has been trading sideways in a range between 22.10 and 25.26. The 50-period SMA is pointing higher, suggesting some bullishness in this market. Silver has also formed two higher reactionary lows, one at 22.21 and another at 22.29.
Institutional Buying and Fibonacci Levels
The latter higher low was established just last week. One could argue that these lows are nearly equal. However, institutional buying has repeatedly entered the market at slightly higher levels each time it approached the 22.10 price level.
Silver technical analysis shows supporting price range between 22.10 and 22.29 aligns with the 61.8% Fibonacci retracement level. This adds to the significance of this price area. The stochastic oscillator is currently at 27.45, indicating that the market is close to being oversold.
Recent Market Activity and the Fed
The oscillator has been as low as 20.16 recently. This suggests that the market remains close to oversold conditions. A bullish hammer candle was also formed last week, adding to the bullish indicators.
The market is trading near the lower end of its range, and the bullish signs are especially noteworthy given the pending Federal Reserve decision. This could significantly affect silver prices both today and in the coming days.
Overview of Bearish Trends
On the bearish side, the market has created lower reactionary highs since the April peak at 26.13. Two lower swing highs have been identified at 25.26 and 25.00.
Resistance Levels and Potential Downside
These serve as major resistance areas for any upcoming rally. As per our silver technical analysis failure to sustain a rally above these levels could indicate weakness in the market. If the market cannot rally and moves decisively below 22.10, further downside is likely. In such a scenario, the market could potentially move down to 21.30.
Daily Silver technical analysis
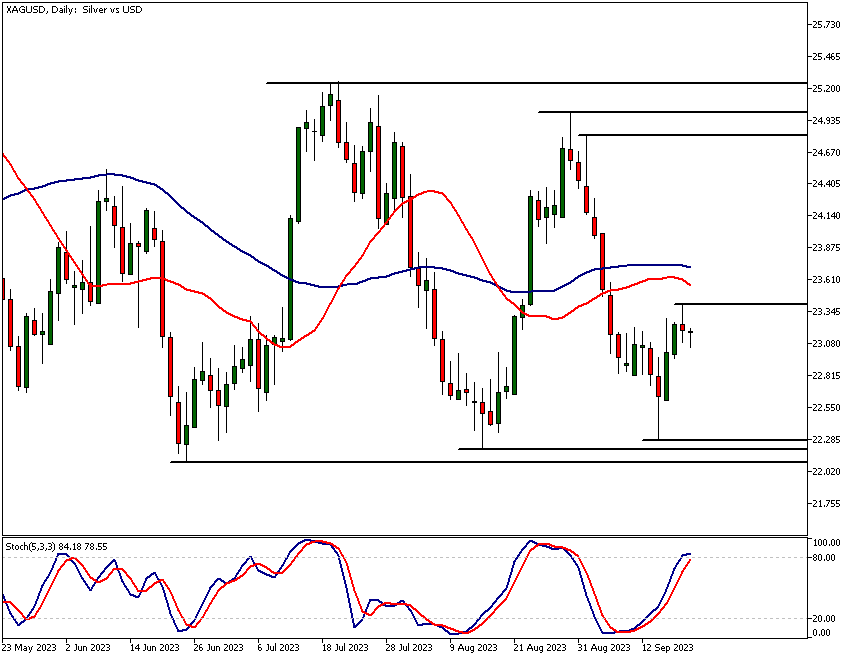
In the daily chart, some market weakness was evident in yesterday's trading. The market failed to close at new highs and formed a bearish shooting star candle instead.
Oscillator and Price Range
If the market now closes below yesterday's low and fails to move above it, it could retest last week's low. The stochastic oscillator is in the overbought area with a current value of 83. The moving averages are essentially moving sideways, indicating a lack of trend in the market. Despite this, the market has been, silver technical analysis shows, fluctuating between support and resistance levels.
Expectations for Price Movement
Given the width of the current range, significant price moves within this weekly range are likely. A recent rally that began in August exceeded 12% in size.
Silver technical analysis, 4h chart
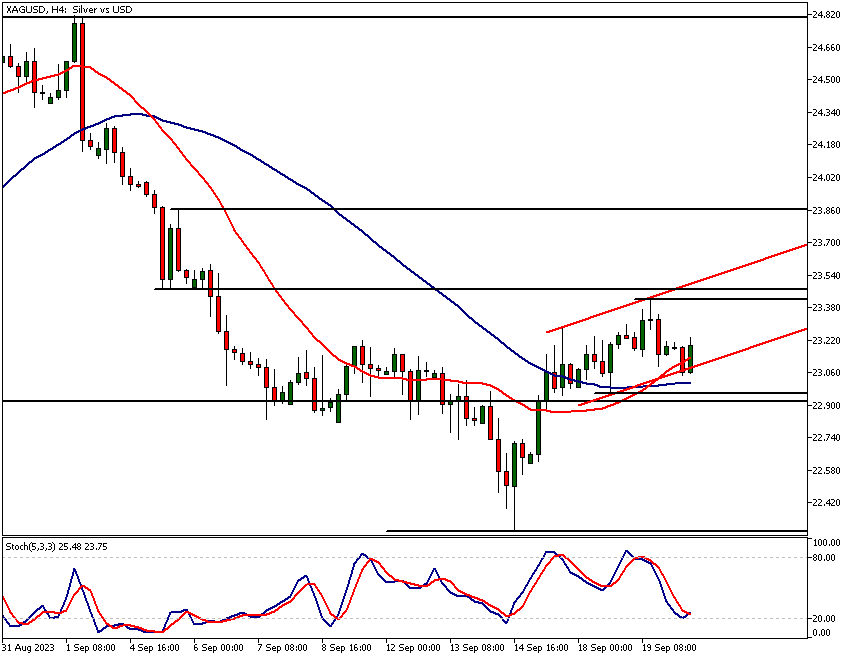
In the 4-hour chart, silver is trading within a bullish price channel. The market retraced to the lower end of the channel before bouncing back. The moving averages are in a bullish alignment, with the faster one above the slower.
Oscillator Readings and Resistance Levels
The stochastic oscillator also shows that the market is close to being oversold in this timeframe. The oscillator is poised to give a buy signal as the market moves higher in the current 4-hour candle. The nearest key resistance level is yesterday's high at 23.42.
Potential Scenarios
Silver technical analysis shows how above this price level is a market structure level at 23.48. A strong rally above this could see the market trading above the bullish channel, potentially reaching 23.86 and even 24.82. However, if the market falls off the bullish channel and trades below 22.95, more weakness or consolidation could be expected in XAGUSD.
Confluence of Technical Indicators
The immediate resistance level to watch is at 7692. Remaining below this point keeps the market in a short-term bearish state. Notably, the 50-period moving average aligns closely with the market structure level at 7549 and the 38.2% Fibonacci retracement. Thus FTSE 100 technical analysis shows the market forming a technical confluence that many market participants are likely to follow.
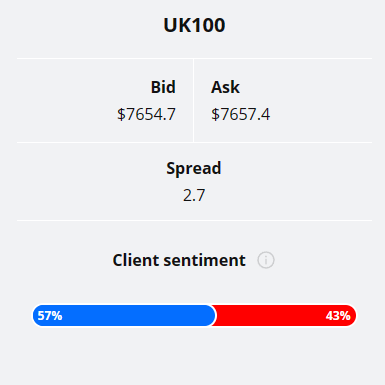
The Client Sentiment indicator doesn't provide strong indication to support (or negate) silver technical analysis indications as clients are positioned somewhat evenly in this market: 56% are long while 44% of them are short the market. It therefore makes sense to trust silver technical analysis and fundamentals in your decision making process.
Please remember that the retail trader client sentiment is a contrarian indicator as most of the retail traders are on average betting against the market trends. This is why, experienced traders tend to trade against the retail client sentiment. You can follow the TIOmarkets client sentiment live on our Forex dashboard.
Silver Fundamental Analysis
The trends in the U.S. dollar impact silver prices significantly. A rising dollar in spring 2021 led to a decline in silver prices. However, when the dollar market peaked in October 2022, silver began a rally, appreciating over 27% since then.
Federal Reserve Policy and Market Expectations
The end of the Federal Reserve's rate hikes is crucial for XAGUSD. Market expectations suggest that rates will remain untouched, with no more hikes this year. Futures traders are pricing in the first Fed rate cut for June 2024, followed by two more in the latter half of 2024.
Demand Stimulants and Investment Trends
A softer U.S. dollar could make silver more affordable, stimulating demand. This could drive up prices, especially if the Federal Reserve is less inclined to fight inflation by raising interest rates. Moreover, a weaker dollar could shift investor focus towards tangible assets like silver.
Geopolitical Factors and Industrial Demand
Historically, silver has been a safe-haven asset. Current geopolitical tensions in Europe could drive further investment into silver. Rising industrial demand, especially from the electric vehicle and solar panel sectors, can also significantly impact the silver market.
Sustainability and Future Valuation
Given the global focus on sustainability, this demand is likely to remain robust. This could counterbalance other economic factors that might otherwise exert downward pressure on silver prices.
Therefore, the growth in 'green' technologies is a pivotal factor for the future valuation of silver. Our silver technical analysis, we hope, helps you in ascertaining the market impact of these fundamental scenarios.
As the factors impacting USD also impact the performance of XAGUSD we recommend you to read more on USD and the US economy using the links below.
NZDUSD analysis

The next main risk events
- USD - Federal Funds Rate
- USD - FOMC Economic Projections
- USD - FOMC Statement
- USD - FOMC Press Conference
- NZD - GDP
- CHF - SNB Monetary Policy Assessment
- CHF - SNB Policy Rate
- CHF - SNB Press Conference
- GBP - Monetary Policy Summary
- GBP - MPC Official Bank Rate Votes
- GBP - Official Bank Rate
- USD - Unemployment Claims
- USD - Philly Fed Manufacturing Index
- EUR - ECB President Lagarde Speaks
- USD - Existing Home Sales
For more information and details see the TIOmarkets economic calendar.
While research has been undertaken to compile the above content, it remains an informational and educational piece only. None of the content provided constitutes any form of investment advice.
Tio Markets UK Limited is a company registered in England and Wales under company number 06592025 and is authorised and regulated by the Financial Conduct Authority FRN: 488900
Risk warning: CFDs are complex instruments and come with a high risk of losing money rapidly due to leverage. 82% of retail investor accounts lose money when trading CFDs with this provider. You should consider whether you understand how CFDs work and whether you can afford to take the high risk of losing your money. Professional clients can lose more than they deposit. All trading involves risk.
DISCLAIMER: Tio Markets offers an exclusively execution-only service. The views expressed are for information purposes only. None of the content provided constitutes any form of investment advice. The comments are made available purely for educational and marketing purposes and do NOT constitute advice or investment recommendation (and should not be considered as such) and do not in any way constitute an invitation to acquire any financial instrument or product. TIOmarkets and its affiliates and consultants are not liable for any damages that may be caused by individual comments or statements by TIOmarkets analysis and assumes no liability with respect to the completeness and correctness of the content presented. The investor is solely responsible for the risk of his/her investment decisions. The analyses and comments presented do not include any consideration of your personal investment objectives, financial circumstances, or needs. The content has not been prepared in accordance with any legal requirements for financial analysis and must, therefore, be viewed by the reader as marketing information. TIOmarkets prohibits duplication or publication without explicit approval.

Janne Muta holds an M.Sc in finance and has over 20 years experience in analysing and trading the financial markets.
