Risk disclaimer: 76% of retail investor accounts lose money when trading CFDs and Spreadbets with this provider. You should consider whether you understand how CFDs and Spreadbets work and whether you can afford to take the high risk of losing your money.
Silver technical analysis | XAGUSD rallies 10%
BY Janne Muta
|October 17, 2023Silver technical analysis - Several factors have helped the price of silver to recover over the last two weeks. Partly the 10% rally in XAGUSD has been due to some safe-haven buying after it became apparent that Israel was going to start a long-term war against Hamas.
Currency and Equity Market Influence
However, other probably more significant factors explaining the rally relate to the USD and the equity markets. Silver is priced in dollars, and when the USD weakens, as it did from 6th October onwards, the price of silver tends to rally.
Silver is also an important industrial metal and as such is correlated with the equity markets. The major US and European equity indices started to rally on Friday, October 6th, triggering buy orders in the silver market as well.
Technical Levels in Silver Market
What makes silver technical analysis vitally important right now is the fact that the market is trading below a pivotal price level and the major equity indices (DJIA, Nasdaq, and Dax) trade at or inside resistance areas. At the time of writing this report, silver has tested a confluence area above the current market price.
Interplay of Equity Indices and Silver
The combination of equity indices and silver being at key resistance areas makes today's price action significant. If risk aversion now kicks in, we should look for a retracement in the price of silver. However, if the confluence area is penetrated and the equity indices continue to rally, we have further evidence that the bulls are in control.
In this silver technical analysis report, we provide traders with the key technical levels and momentum analysis. We hope it will help you to make better trading decisions!
The next key risk events for silver are:
- US Retail Sales (today)
- US Industrial Production (today)
- China Industrial Production
- FOMC Speeches: Waller and Harker
Silver technical analysis
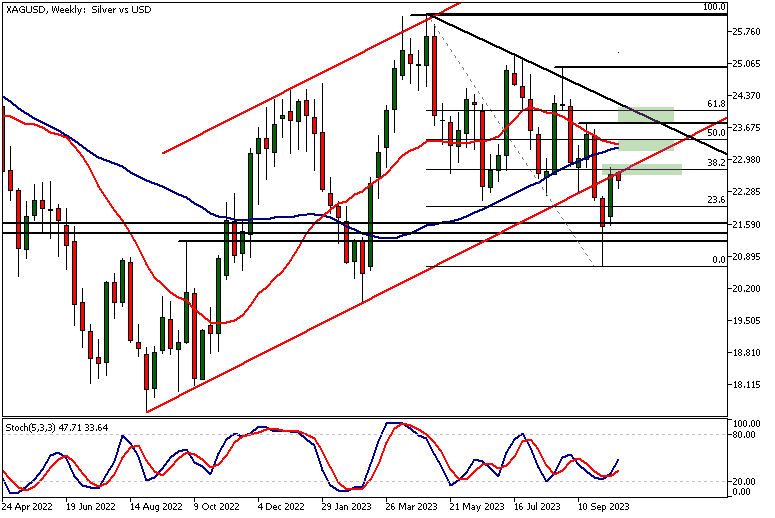
Weekly Silver technical analysis
Silver rallied over 10% since the low two weeks ago. This rally brought the market to the lower end of an ascending trend channel. The level also coincides with the 38.2% Fibonacci retracement level that stopped the rally last week. Last week's high at 22.81, the bull channel low, and the 38.2% retracement level have therefore created a confluence area that could act as a resistance area.
Projections for the Next Target Area in Technical Analysis
Our silver technical analysis identifies the next confluence area above 22.81 around the 50% Fibonacci level (23.40) where the SMA(20) and SMA(50) are somewhat closely aligned with the 50% level. Should the market be able to rally above the nearest confluence area, the 23.40 region could be an area swing traders target.
Short-Term and Medium-Term Indicators
Indicator-based silver technical analysis suggests an upward bias near term with the Stochastic Oscillator giving a buy signal after the strong rally last week. However, the medium-term SMA indication, with the market trading well below the SMA(50) and the SMA(20) pointing lower, is more bearish.
Concerns Regarding Medium-Term Market Momentum
The fact that the market has also created a series of lower highs and lower lows suggests that in the medium-term it could be difficult for this market to maintain significant upside momentum.
Historical Confluence Areas and Their Significance
Note, however, that the market is trading above a historically important confluence area (21.21 - 21.60). This area has acted both as a support and resistance zone since March 2008. Our historical silver technical analysis shows that the market has been able to create significant price trends to the upside when it has been trading higher from this zone.
Historical Patterns and Market Direction
And, when the market has been trading lower from this area, the downtrends it has created have been substantial. Therefore, should the bulls create higher swing lows above this historical confluence area, the probability of a significant bull run in silver could be relatively high.
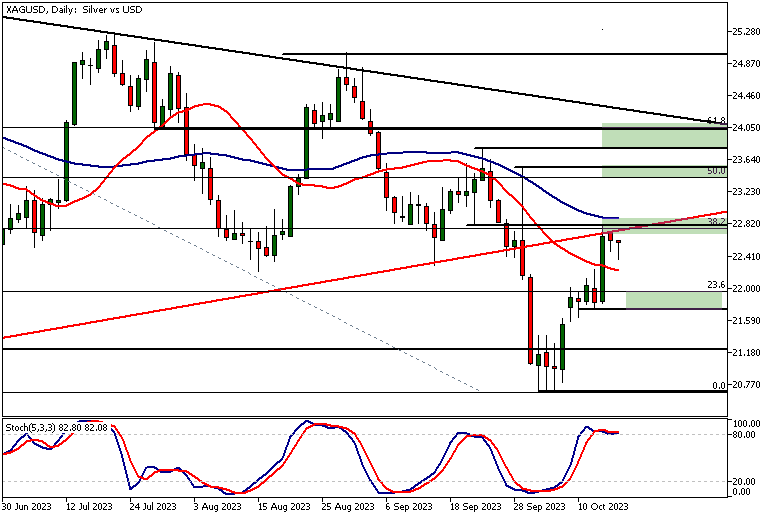
Daily Silver technical analysis
Silver technical analysis in the daily timeframe chart shows the market is oversold in terms of both the Stochastic Oscillator and levels analysis. The stochastic oscillator is currently above 80 and the market trades right below a confluence area where a market structure level, the bullish channel low, the 38.2 Fibonacci retracement level, and the SMA(50) are closely aligned.
Potential Retracement Scenarios and Re-Engagement Levels for Bulls
This could result in a retracement in the price of silver, which in turn raises the question of where, under that scenario, the silver bulls could re-engage with the market. The answer might well be found in the ABCD rally the market created over the last two weeks.
Daily Chart Analysis and Minor Support Level
In the daily chart, we can see an ABCD type of rally from the silver market low two weeks ago. The pause in the rally created a minor daily support level at 21.74. The level coincides with the 23.6% Fibonacci retracement level, creating a confluence area at 21.74 - 21.95. This area could attract buyers if the market retraces back to it. If the area doesn't attract buyers, look for a move to 21.21 or so.
Alternate Scenario: Rallying Without Significant Retracement
Another possible scenario is the market rallying without a significant retracement. Our silver technical analysis suggests that if the price of silver can sustain a rally above the 50-period SMA (at 22.88), we could see the market rallying to the 23.40 - 23.54 range. This trade idea is valid only if price action above the SMA(50) remains bullish.
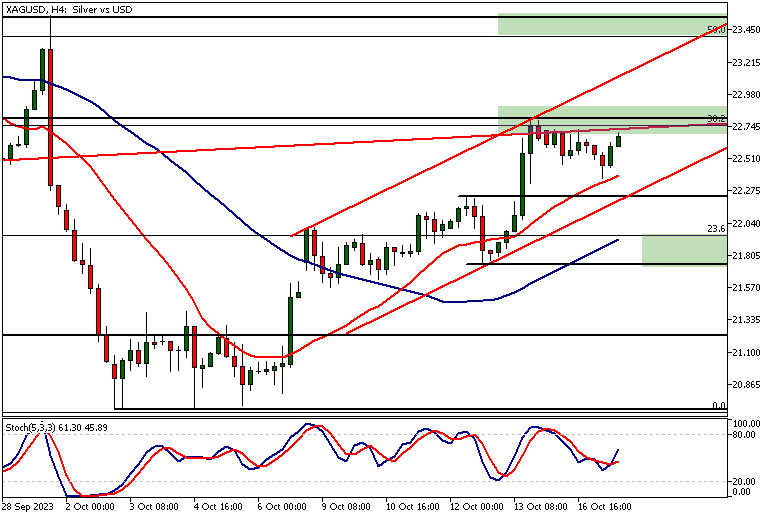
Silver technical analysis, 4h chart
The 4h silver technical analysis shows the moving averages in a bullish alignment, with the SMA(20) above the SMA(50). Both averages are pointing higher, indicating momentum in this timeframe. The Stochastic Oscillator could soon give a buy signal if the current upside push in the market continues.
Nearest Support Levels and Implications for Price Movements
The nearest support level is at 22.23, with the bullish channel low currently at 22.15. Should these levels fail to support the price, look for a move down to the 21.74 - 21.95 confluence zone identified in the daily silver technical analysis above.

The Client Sentiment indicator shows that 59% of the TIOmarkets' clients are long while 41% of them are holding short positions. To get a more comprehensive view on the likely price swings in this market, combine silver technical analysis and fundamentals with the client sentiment indication.
Please remember that the retail trader client sentiment is a contrarian indicator as most of the retail traders are on average betting against the market trends. This is why, experienced traders tend to trade against the retail client sentiment. You can follow the TIOmarkets client sentiment live on our Forex dashboard.
The key takeaways from this report
- Silver's weekly technical analysis highlights a key resistance confluence area at 22.81, which aligns with the 38.2% Fibonacci retracement level. The next target for swing traders is the 50% Fibonacci level at 23.40, where SMA(20) and SMA(50) are closely aligned.
- In the medium term, silver's outlook appears bearish as it trades below SMA(50) and has shown a pattern of lower highs and lower lows. However, the market is currently above a significant historical support zone between 21.21 - 21.60, which could trigger a bullish trend if maintained.
- On the daily timeframe, silver is oversold with a Stochastic Oscillator reading above 80. A minor daily support level lies at 21.74, aligned with the 23.6% Fibonacci retracement level, making 21.74 - 21.95 a potential buy zone upon retracement.
- If silver sustains a rally above the 50-period SMA at 22.88, the next target range is 23.40 - 23.54. This trading strategy is contingent on maintaining bullish price action above the SMA(50).
- The 4h chart analysis shows bullish momentum with SMA(20) above SMA(50). Both averages are inclined upwards. Immediate support resides at 22.23, and the bullish channel low is at 22.15. A break below these could lead to a move towards 21.74 - 21.95.
- For intraday traders, monitoring the Stochastic Oscillator on the 4h chart could be crucial. A buy signal from this indicator aligned with current bullish momentum may provide a short-term trading opportunity.
Read more silver technical analysis
Read more silver technical analysis

The next main risk events
- CAD - CPI
- USD - Core Retail Sales
- USD - Retail Sales
- USD - Industrial Production
- AUD - RBA Gov Bullock Speaks
- CNY - Industrial Production
- CNY - GDP
- CNY - Retail Sales
- GBP - CPI
- USD - Building Permits
- USD - FOMC Member Waller Speaks
- USD - FOMC Member Harker Speaks
- AUD - Employment Change
- AUD - Unemployment Rate
- USD - Unemployment Claims
- USD - Philly Fed Manufacturing Index
- USD - Existing Home Sales
- USD - Fed Chair Powell Speaks
- USD - FOMC Member Harker Speaks
- CNY - 1-y Loan Prime Rate
- CNY - 5-y Loan Prime Rate
- NZD - RBNZ Statement of Intent
For more information and details see the TIOmarkets economic calendar.
While research has been undertaken to compile the above content, it remains an informational and educational piece only. None of the content provided constitutes any form of investment advice.
Tio Markets UK Limited is a company registered in England and Wales under company number 06592025 and is authorised and regulated by the Financial Conduct Authority FRN: 488900
Risk warning: CFDs are complex instruments and come with a high risk of losing money rapidly due to leverage. 82% of retail investor accounts lose money when trading CFDs with this provider. You should consider whether you understand how CFDs work and whether you can afford to take the high risk of losing your money. Professional clients can lose more than they deposit. All trading involves risk.
DISCLAIMER: Tio Markets offers an exclusively execution-only service. The views expressed are for information purposes only. None of the content provided constitutes any form of investment advice. The comments are made available purely for educational and marketing purposes and do NOT constitute advice or investment recommendation (and should not be considered as such) and do not in any way constitute an invitation to acquire any financial instrument or product. TIOmarkets and its affiliates and consultants are not liable for any damages that may be caused by individual comments or statements by TIOmarkets analysis and assumes no liability with respect to the completeness and correctness of the content presented. The investor is solely responsible for the risk of his/her investment decisions. The analyses and comments presented do not include any consideration of your personal investment objectives, financial circumstances, or needs. The content has not been prepared in accordance with any legal requirements for financial analysis and must, therefore, be viewed by the reader as marketing information. TIOmarkets prohibits duplication or publication without explicit approval.

Janne Muta holds an M.Sc in finance and has over 20 years experience in analysing and trading the financial markets.
