Risk disclaimer: 76% of retail investor accounts lose money when trading CFDs and Spreadbets with this provider. You should consider whether you understand how CFDs and Spreadbets work and whether you can afford to take the high risk of losing your money.
Silver technical analysis | USD Strength Weighs on Silver
BY Janne Muta
|September 26, 2023Silver technical analysis report shows the silver market trading near to a key daily timeframe price level at 22.80. Read this report to see how the latest Fed dot-plot and the USD strength have pressured the silver market.
Despite maintaining the rate of 5.25%-5.5% (22-year high) in their September 2023 meeting, the Fed signalled the possibility of another rate hike later in the year. This supported the dollar and weighed on the price of silver.
However, futures traders are pricing in only a 35% probability of a 25 basis point rate hike for 2023, indicating market scepticism about further tightening.
Silver's Cyclicality and Equity Market Performance
The weakness observed in silver can also be attributed to the weakness in equity indices this week. Silver, being an essential component in numerous industrial processes, exhibits a degree of cyclicality.
Our silver technical analysis shows how the USD strength often exerts downward pressure on silver prices, as a strong dollar makes commodities like silver more expensive for international buyers. Additionally, a weak performance in equity indices can signal broader economic concerns and reduced demand for commodities, including silver, which further contributes to its weakness.
Economic Conditions and Industrial Demand
Given its integral role in industrial applications, silver's price is sensitive to economic conditions and industrial production levels. During economic downturns or periods of reduced industrial activity, the demand for silver in various industrial processes can decline, impacting its price negatively.
The key takeaways from silver technical analysis report
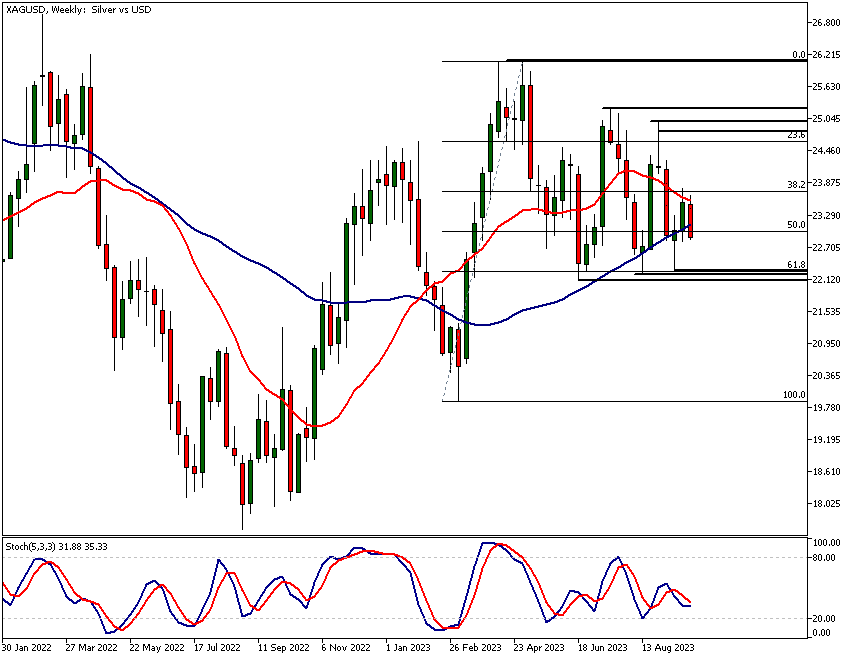
- The weekly silver market has weakened, losing gains from previous weeks. The 20-period moving average acts as resistance and aligns with the 38.2% Fibonacci retracement level at 23.73. A lower high this week suggests reduced bullish momentum.
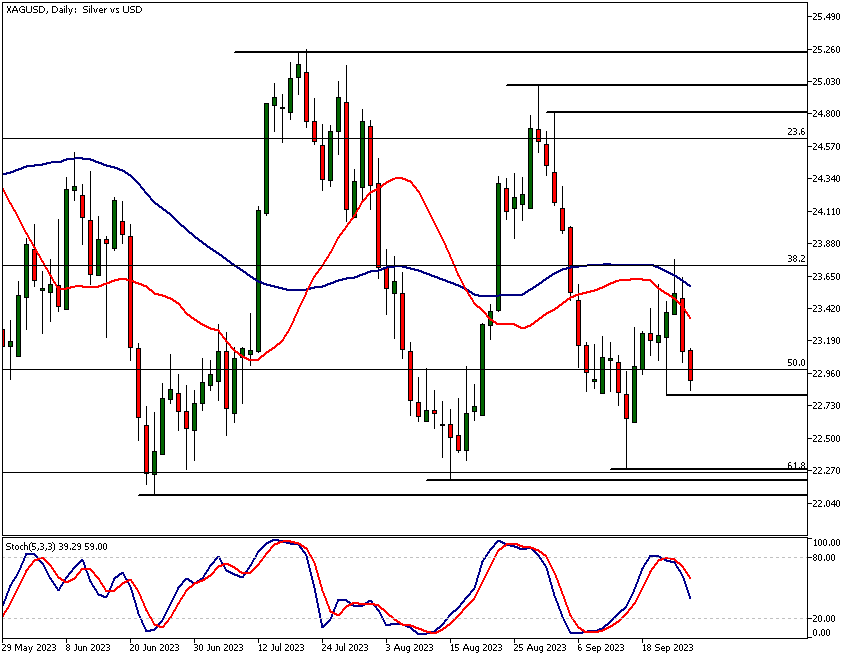
- On the daily chart, silver faces bearish pressure after failing at 22.77, where the 38.2% Fibonacci retracement and 50-period moving average intersect. A bearish shooting star candle and stochastic oscillator sell signal followed, pushing the market down.
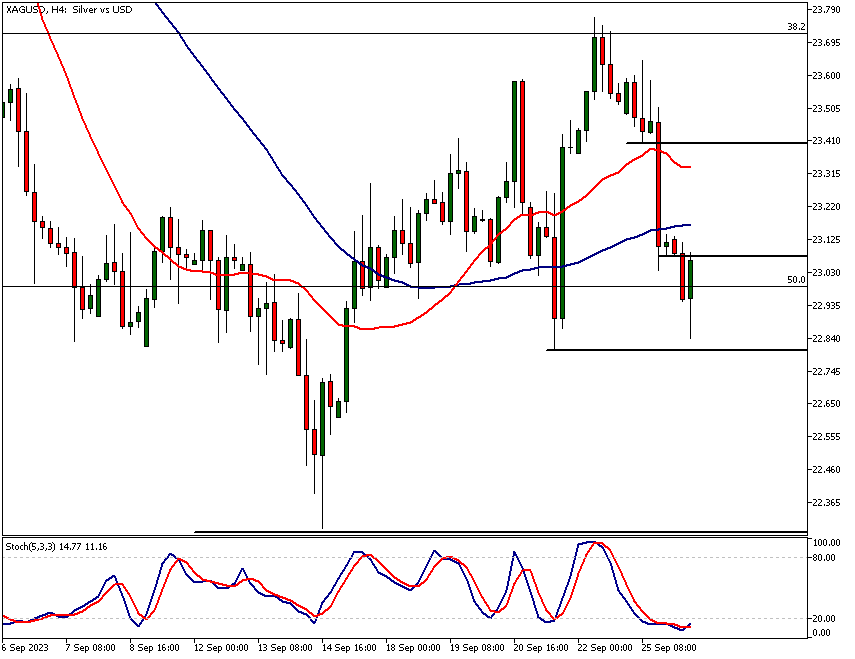
- In the 4-hour silver chart, the Stochastic Oscillator is in oversold territory, indicating potential for a price rebound. For a sustainable rally, prices need to surpass a minor resistance level at 23.07, opening the path to 23.40.
- Client sentiment reveals that 60% of TIOmarkets' clients are long, while 40% are short on silver. This contrarian indicator suggests experienced traders may opt to trade against prevailing retail sentiment.
- In terms of fundamentals, the Federal Reserve's monetary policy impacts silver prices via its effect on the U.S. dollar. Dollar strength following a potential rate hike has contributed to recent silver price declines.
- Inflationary pressures in the U.S. could warrant a hawkish stance, potentially impacting silver negatively. However, modest GDP growth and a softening labour market could encourage a more dovish approach, offering a mixed outlook for silver prices.
The next key risk events for silver are:
- US Consumer Board Consumer Confidence
- US Core Durable Goods Orders
- US Final GDP
Silver technical analysis
Weekly Silver technical analysis
After rallying for two weeks from a key support level at 22.29 the silver market has been trading lower this week. The market has lost almost all the gains it made a week before.
Weakness in Silver Bulls
This week's high is lower than the high of the previous week suggesting weakness among the silver bulls. They weren't able to push the market as high as last week let alone moving the market above last week's high at 23.77.
The 20-period moving average has been pointing lower and has acted as a resistance this week. Our silver technical analysis also shows that the 20-period moving average roughly coincided with the 38.2% Fibonacci retracement level at 23.73.
The 50-period moving average is still pointing higher but the fast and slow moving averages are converging. This indicates a lack of upside momentum in the market.
Stochastic Oscillator's Indecision
The stochastic oscillator doesn't give a clear signal at the moment. However, if the market creates a higher swing low above 22.29 The stochastic oscillator probably gives a buy signal sooner or later.
The market is trading sideways above a key support area. Silver technical analysis highlights the lower end of this zone at 22.10 and the upper end of the support area is at 22.29. This price zone coincides with the 61.8%
Fibonacci retracement level, which adds to the significance of this price area. The more traders are likely to see and pay attention to a price zone the higher significance it has.
Formation of Lower Swing Highs
The upper end of the range the market trades in is created by a series of lower swing highs. After the silver market established the YTD high at 26.13 it has created to lower highs at 25.26 and 25.00.
If the market attracts buyers above the key support zone at 22.10 - 22.29 it might rally to last week's high (23.77). And if the Bulls can push the market significantly above 23.77 we might see silver trading higher to 24.28 or so.
Daily Silver technical analysis
Two days ago the silver market rally failed at 22.77 where the 38.2% Fibonacci retracement level and the 50 period moving average in the daily chart coincided.
Bearish Signals and Market Movement
This resulted in a bearish shooting star candle on Friday. At the same time, the stochastic oscillator gave a sell signal. These signals were followed by a strong down move in yesterday's trading.
Silver technical analysis in the daily chart shows that the market is now trading relatively close to the 22.80 level that attracted buyers three days ago.
Potential Market Scenarios
If the 22.80 Level doesn't hold we might see a push towards the 22.29 low. However, if the buyer is engaged in the market around the 2280 level look for a move to the area between the moving averages. The fast and slow moving averages in the daily chart create a dynamic resistance area between 23.34 and 23.57.
Silver technical analysis, 4h chart
In the 4-hour chart, Stochastic Oscillator is firmly in the oversold territory and the market has traded higher after almost touching the 22.80 support level. If the strength continues the oscillator could soon give a buy signal.
Future Market Projections
At the time of writing this, silver has rallied to a minor resistance level at 23.07. For the market to create a sustainable rally it needs to maintain levels above 23.07.
A decisive rally above this level could open the way to 23.40 or so. Alternatively, silver technical analysis shows, a break below 22.80 might well take the market down to 22.73.Silver technical analysis, 4h chart
In the 4-hour chart, Stochastic Oscillator is firmly in the oversold territory and the market has traded higher after almost touching the 22.80 support level. If the strength continues the oscillator could soon give a buy signal.
Future Market Projections
At the time of writing this, silver has rallied to a minor resistance level at 23.07. For the market to create a sustainable rally it needs to maintain levels above 23.07.
A decisive rally above this level could open the way to 23.40 or so. Alternatively, silver technical analysis shows, a break below 22.80 might well take the market down to 22.73.

The Client Sentiment indicator shows that 60% of the TIOmarkets' clients are long while 40% of them are holding short positions. To get a more comprehensive view on the likely price swings in this market, combine silver technical analysis and fundamentals with the client sentiment indication.
Please remember that the retail trader client sentiment is a contrarian indicator as most of the retail traders are on average betting against the market trends. This is why, experienced traders tend to trade against the retail client sentiment. You can follow the TIOmarkets client sentiment live on our Forex dashboard.
Silver Fundamental Analysis
The Federal Reserve's monetary policy has a direct impact on the value of the U.S. dollar and therefore also silver (XAGUSD) that is priced in the USD. The recent weakness in the price of silver can be attributed to the dollar strength that followed the publication of the Fed dot-plot that suggested one more rate hike for this year.
Inflationary Pressures and Hawkish Stance
The recent macroeconomic data from the U.S. shows, inflationary pressures are evident, with both core and overall consumer prices exceeding market expectations.
The annual inflation rate also accelerated to 3.7%, and producer prices rose by 0.7%, surpassing market forecasts. These trends could typically warrant a hawkish stance to tighten monetary policy, thereby curbing inflation.
While the Fed policy can affect the price of silver in the long run silver technical analysis can help traders make sense of daily price fluctuations.
Economic Slowdown and Dovish Indicators
On the other hand, there are indicators that could encourage a more dovish or cautious approach. The GDP growth rate for the second quarter was modest and lower than initially estimated, indicating slowing economic activity.
Employment gains have been below the 200,000 threshold for three consecutive months, and the unemployment rate increased to 3.8%, its highest in over a year. These are signs of a softening labour market, which usually does not favour a hawkish approach.
Federal Reserve's Current Stance and Market Sentiment
Despite maintaining the rate of 5.25%-5.5% (22-year high) in their September 2023 meeting, the Fed signalled the possibility of another rate hike later in the year. However, futures traders are pricing in only a 35% probability of a 25 basis point rate hike for 2023, indicating market scepticism about further tightening.
We hope that our silver technical analysis helps you to understand the impact of the fundamentals in the price of silver.
As the factors impacting USD also impact the performance of XAGUSD we recommend you to read more on USD and the US economy using the links below.
NZDUSD analysis

The next main risk events
- USD S&P/CS Composite-20 HPI
- USD CB Consumer Confidence
- USD New Home Sales
- USD Richmond Manufacturing Index
- AUD CPI
- USD Core Durable Goods Orders m/m
- USD Durable Goods Orders m/m
- CHF SNB Chairman Jordan Speaks
- AUD Retail Sales
- EUR German Prelim CPI
- EUR Spanish Flash CPI
- USD Final GDP
- USD Unemployment Claims
- USD Final GDP Price Index
- USD Pending Home Sales m/m
- USD Fed Chair Powell Speaks
- JPY Tokyo Core CPI
- EUR ECB President Lagarde Speaks
- EUR Core CPI Flash Estimate
- EUR CPI Flash Estimate
- CAD GDP
- USD Core PCE Price Index
- USD Chicago PMI
- USD Revised UoM Consumer Sentiment
- USD FOMC Member Williams Speaks
- CNY Manufacturing PMI
- CNY Non-Manufacturing PMI
For more information and details see the TIOmarkets economic calendar.
While research has been undertaken to compile the above content, it remains an informational and educational piece only. None of the content provided constitutes any form of investment advice.
Tio Markets UK Limited is a company registered in England and Wales under company number 06592025 and is authorised and regulated by the Financial Conduct Authority FRN: 488900
Risk warning: CFDs are complex instruments and come with a high risk of losing money rapidly due to leverage. 82% of retail investor accounts lose money when trading CFDs with this provider. You should consider whether you understand how CFDs work and whether you can afford to take the high risk of losing your money. Professional clients can lose more than they deposit. All trading involves risk.
DISCLAIMER: Tio Markets offers an exclusively execution-only service. The views expressed are for information purposes only. None of the content provided constitutes any form of investment advice. The comments are made available purely for educational and marketing purposes and do NOT constitute advice or investment recommendation (and should not be considered as such) and do not in any way constitute an invitation to acquire any financial instrument or product. TIOmarkets and its affiliates and consultants are not liable for any damages that may be caused by individual comments or statements by TIOmarkets analysis and assumes no liability with respect to the completeness and correctness of the content presented. The investor is solely responsible for the risk of his/her investment decisions. The analyses and comments presented do not include any consideration of your personal investment objectives, financial circumstances, or needs. The content has not been prepared in accordance with any legal requirements for financial analysis and must, therefore, be viewed by the reader as marketing information. TIOmarkets prohibits duplication or publication without explicit approval.

Janne Muta holds an M.Sc in finance and has over 20 years experience in analysing and trading the financial markets.
