Risk disclaimer: 76% of retail investor accounts lose money when trading CFDs and Spreadbets with this provider. You should consider whether you understand how CFDs and Spreadbets work and whether you can afford to take the high risk of losing your money.
Nasdaq 100 technical analysis | The Hamas-Israel war worries investors
BY Janne Muta
|October 23, 2023Nasdaq 100 technical analysis - On Friday, U.S. stock markets traded lower, marking the fourth consecutive session of losses. The Nasdaq 100 declined by 1.3%, while the Dow Jones Industrial Average fell by 287 points, or 0.9%.
Key Triggers for the Decline
The declines were triggered by a confluence of factors, primarily rising Treasury yields and geopolitical tensions in the Middle East. The 10-year U.S. Treasury yield settled at 4.924%, a slight decrease from 4.987% on Thursday.
Bond Investors' Sentiment Affected by Treasury Yields
The rapid rise in Treasury yields, increasing by more than a full percentage point in a relatively short time, has led to negative sentiment among bond investors, who are also concerned about the growing size of government borrowing.
Continuation of Nasdaq 100's Weakness Since July
The weakness in the Nasdaq 100 index started in July, but the latest down leg in this market emerged after we reported how the higher-than-expected CPI and lack of demand in the treasury auction pushed the yields higher. The rate-sensitive Nasdaq has since dropped over 4% as the 10-year yield has risen from 4.701% to 4.967%.
In this Nasdaq 100 technical analysis report we provide our readers with an updated view on the index and discuss both the bearish and bullish scenarios together with key support and resistance levels and technical confluence zones.
The next key risk events for Nasdaq are
- USD - Flash Manufacturing PMI
- USD - Flash Services PMI
- USD - Richmond Manufacturing Index
- USD - New Home Sales
- USD - Fed Chair Powell Speaks
- USD - Advance GDP
Read the full Nasdaq 100 technical analysis report below
Nasdaq 100 Technical Analysis
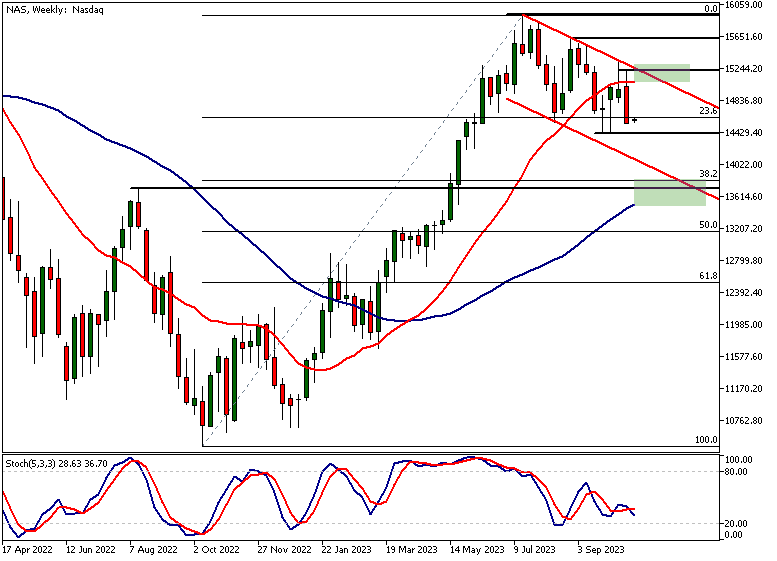
Weekly Nasdaq 100 Technical Analysis
Nasdaq has created yet another lower swing high in the weekly chart. The weakness in the index started in the summer, but ten days ago we reported how the high CPI and lack of demand in the treasury auction pushed the yields higher. The rate-sensitive Nasdaq has since dropped over 4% as the 10-year yield has risen from 4.701% to 4.967%.
Long-term Bullish Trend Weakening
Indicator-driven Nasdaq 100 technical analysis still suggests that the long-term trend is bullish. The fast SMA(20) is above the slow SMA(50) and the Stochastic oscillator is nearing oversold levels. However, there are signs of weakness too. The market has not been able to close above the SMA(20) since mid-September and the SMA(20) is currently moving sideways.
Signs of Bearishness
Furthermore, price action suggests bearishness in technology stocks. Since the July high the index has created two lower swing highs in the weekly chart. These lower reactionary highs indicate that the market is weak and therefore more likely to break below the support levels.
Key Weekly Support Levels
Nasdaq trades relatively close to a key weekly support level (14 429) which could slow the decline and even rally the market but the recent price action suggests such rallies could fail. If the 14 429 level is broken decisively a more significant decline could be ahead.
Short-term Targets in a Bearish Scenario
Under this scenario, the first technical level to focus on is the bear channel low (currently at 14 072) while the next technical confluence area is at 13 517 - 13 817. Our Nasdaq 100 technical analysis suggests the bears be targeting the confluence area but we might see some profit-taking at the bear channel low.
Alternative Scenario if Support Holds
Alternatively, should the 14 429 support attract buying, we might see a move to 14 890 or so. Above this, the nearest confluence area in the weekly chart is at 15 071 - 15 210. The bear channel high, a market structure level and the SMA(20) coincide within this range.
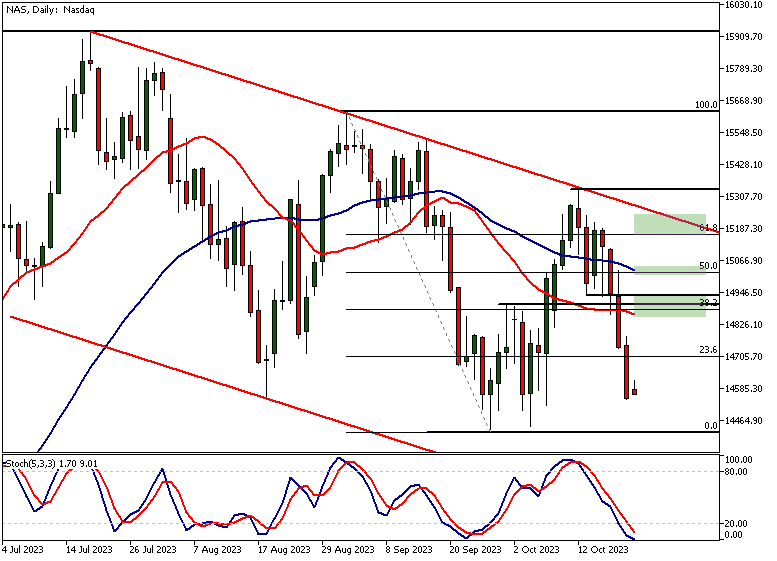
Daily Nasdaq 100 Technical Analysis
The daily chart shows how there has been only one bullish day since our last Nasdaq 100 technical analysis report. We suggested then that the market could be weak due to the higher-than-expected CPI and lack of demand in the treasury auction.
New Resistance Zone Following Market Structure Break
The decline broke a market structure level at 14 904 creating a resistance zone above the current market price. This confluence zone (at 14 863 - 14 939) consists of two market structure levels, the SMA(20) and the 38.2% Fibonacci retracement level. The next two confluence areas are relatively close by at 15 021 - 15 031 and 15 171 - 15 260.
Indicator-Based Bearishness
Technical indicator-based Nasdaq 100 technical analysis suggests continued bearishness with the SMA(20) below the SMA(50) and both averages pointing lower. They indicate that the trend is down while the Stochastic oscillator's oversold condition suggests that the market is nearing a potential low in this price swing.
Limitations of Indicator-Driven Analysis
We should not however make trading decisions based on such indications alone. The stochastic oscillator is just a set of lines that are moved about by the price action and a mathematical formula. We need to combine the indications with price action and the market structure.
Importance of Holistic Analysis for Decision-Making
Here we have the market approaching a key support level which gives more credibility to this indication. but we don't know yet if the market will honour or break the support level. Therefore, it's good to include factors mentioned in our weekly Nasdaq 100 technical analysis in the decision-making process before taking new trades (or closing old ones).
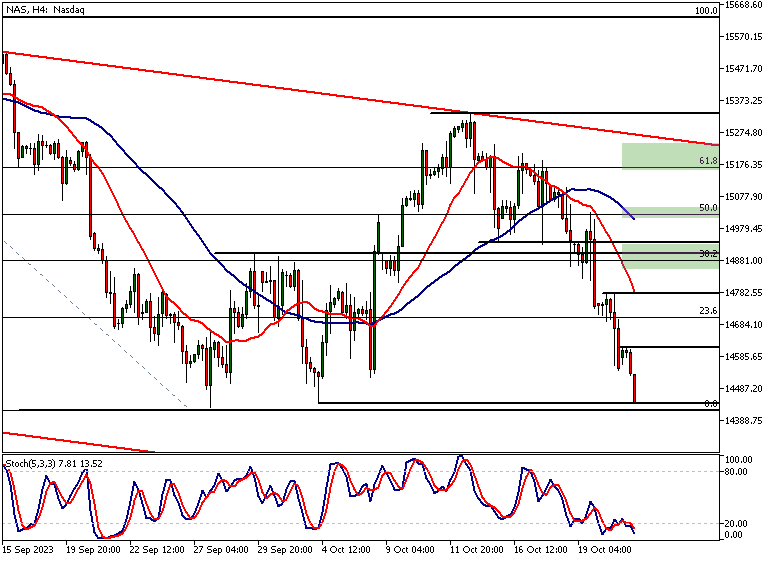
Nasdaq 100 Technical Analysis, 4h
The 4h chart shows the market breaking support levels and creating new resistance levels. Both moving averages are pointing lower with the SMA(20) below the SMA(50). The market is clearly trending down. The nearest resistance level is at 14 614. Above this, we could see the market trading to 14 782. The nearest 4h support level is at 14 429.

Almost 95% of TIOmarkets' retail traders are bullish on Nasdaq. Only 6% are currently holding bearish positions.
It’s good to remember that the retail trader client sentiment is a contrarian indicator as most of the retail traders are on average betting against the market trends. This is why, experienced traders tend to trade against the retail client sentiment. You can follow the TIOmarkets client sentiment live on our Forex dashboard.
The key takeaways from this report
- Nasdaq 100's recent decline has been influenced by a rise in 10-year Treasury yields, from 4.701% to 4.967%. The index has dropped over 4% during this period, reflecting a bearish sentiment in the market.
- The weekly chart shows two lower swing highs since July, indicating weakness. A significant support level to watch is at 14 429. Breaking below this could lead to a more substantial decline.
- In the daily chart, the SMA(20) is below the SMA(50), both pointing downwards, indicating bearishness. A key resistance zone has been established at 14 863 - 14 939 following a market structure break.
- Short-term targets in a bearish scenario are 14 072 and a confluence area at 13 517 - 13 817. Traders should watch for potential profit-taking at 14 072, which is the bear channel low.
- For those considering a bullish scenario, if the 14 429 support holds, the next target is 14 890. A key confluence area in the weekly chart lies between 15 071 - 15 210.
- Upcoming risk events include speeches by Fed Chair Powell and the release of Advance GDP and Flash Manufacturing PMI data. These events could provide new directional cues for the Nasdaq 100.
Read more Nasdaq 100 technical analysis
Read more Nasdaq 100 technical analysis
We hope that our Nasdaq 100 technical analysis helps you to make better trading decisions!

The next main risk events
- GBP - Claimant Count Change
- EUR - French Flash Manufacturing PMI
- EUR - French Flash Services PMI
- EUR - German Flash Manufacturing PMI
- EUR - German Flash Services PMI
- AUD - RBA Gov Bullock Speaks
- EUR - Flash Manufacturing PMI
- EUR - Flash Services PMI
- GBP - Flash Manufacturing PMI
- GBP - Flash Services PMI
- EUR - ECB President Lagarde Speaks
- USD - Flash Manufacturing PMI
- USD - Flash Services PMI
- USD - Richmond Manufacturing Index
- AUD - CPI
- AUD - Trimmed Mean CPI
- EUR - German ifo Business Climate
- CAD - BOC Monetary Policy Report
- CAD - BOC Rate Statement
- CAD - Overnight Rate
- USD - New Home Sales
- CAD - BOC Press Conference
- EUR - ECB President Lagarde Speaks
- USD - Fed Chair Powell Speaks
- EUR - Main Refinancing Rate
- EUR - Monetary Policy Statement
- USD - Advance GDP
- USD - Unemployment Claims
- USD - Advance GDP Price Index
- USD - Core Durable Goods Orders
- USD - Durable Goods Orders
- EUR - ECB Press Conference
- USD - FOMC Member Waller Speaks
- USD - Pending Home Sales
- JPY - Tokyo Core CPI
- NZD - RBNZ Statement of Intent
- USD - Core PCE Price Index
- USD - Revised UoM Consumer Sentiment
For more information and details see the TIOmarkets economic calendar.
While research has been undertaken to compile the above content, it remains an informational and educational piece only. None of the content provided constitutes any form of investment advice.
Tio Markets UK Limited is a company registered in England and Wales under company number 06592025 and is authorised and regulated by the Financial Conduct Authority FRN: 488900
Risk warning: CFDs are complex instruments and come with a high risk of losing money rapidly due to leverage. 82% of retail investor accounts lose money when trading CFDs with this provider. You should consider whether you understand how CFDs work and whether you can afford to take the high risk of losing your money. Professional clients can lose more than they deposit. All trading involves risk.
DISCLAIMER: Tio Markets offers an exclusively execution-only service. The views expressed are for information purposes only. None of the content provided constitutes any form of investment advice. The comments are made available purely for educational and marketing purposes and do NOT constitute advice or investment recommendation (and should not be considered as such) and do not in any way constitute an invitation to acquire any financial instrument or product. TIOmarkets and its affiliates and consultants are not liable for any damages that may be caused by individual comments or statements by TIOmarkets analysis and assumes no liability with respect to the completeness and correctness of the content presented. The investor is solely responsible for the risk of his/her investment decisions. The analyses and comments presented do not include any consideration of your personal investment objectives, financial circumstances, or needs. The content has not been prepared in accordance with any legal requirements for financial analysis and must, therefore, be viewed by the reader as marketing information. TIOmarkets prohibits duplication or publication without explicit approval.

Janne Muta holds an M.Sc in finance and has over 20 years experience in analysing and trading the financial markets.
