Risk disclaimer: 76% of retail investor accounts lose money when trading CFDs and Spreadbets with this provider. You should consider whether you understand how CFDs and Spreadbets work and whether you can afford to take the high risk of losing your money.
Nasdaq 100 Technical Analysis | Doji candle signals loss of downside momentum
BY Janne Muta
|January 8, 2024Nasdaq 100 Technical Analysis - Last week, major stock indices, including the Nasdaq 100, saw their winning streaks end. The Nasdaq Composite fell by 3.2%, while the S&P 500 dropped 1.5% and the Dow Jones Industrial Average slipped 0.6%. This decline was partly due to technology giants like Apple, Amazon, Tesla, and Alphabet losing value, prompting investors to take profits after a strong 2023.
Economically, December's job report exceeded expectations with 216K new jobs, though revisions to previous months raised concerns about the Federal Reserve's interest rate plans. A drop in the US services sector index also raised worries. Currently, Fed Funds futures traders are pricing in a 63.8% chance of the first rate cut in March, with expectations for a total of six 25-basis-point cuts this year.
In December, the US ISM Services PMI unexpectedly fell to 50.6, a seven-month low, below forecasts. New orders, employment, and inventories contracted, while production grew. Price pressures eased, and supplier deliveries slightly improved. Respondents cited economic uncertainty, geopolitical events, and labour shortages as concerns.
Middle East geopolitical tensions and Red Sea shipping disruptions are impacting sentiment market, as wider disruptions could increase inflation. This week, market participants focus on US inflation data and earnings reports for market insights.
Summary of This Nasdaq 100 Technical Analysis Report:
- Last week, the market dropped 3.2% to 16,165, marking its first significant decline since October. With key support at 15,931 and resistance at 16,971, the market is still in a long-term uptrend, shown by the 20-period moving average over the 50-period SMI. At the same time though, the distance from the moving adds to the risk of market correcting further.
- The daily NASDAQ chart shows indecision after a narrow-range candle post-NFP numbers, hinting at a possible reversal. A rally above 16,418 indicates an uptrend resumption, while falling below 16,165 could lead to a drop towards the 50-period average at 15,946. The stochastic oscillator nears a buy signal, suggesting a bullish possibility.
- On the two-hour chart, the market broke out of a descending trend channel but faced resistance at 16,420. A higher swing low above 16,176 would be bullish, potentially pushing past 16,420 towards 16,551 and then 16,750. If it falls below 16,176, a downward trend to 15,946 might occur.
Read the full Nasdaq 100 technical analysis report below.
Nasdaq 100 Technical Analysis

Weekly Nasdaq 100 Technical Analysis
Last week, the market experienced a 3.2% decline, reaching a support level at 16,165. This marked the first significant retracement since the market began rallying at the end of October. The market failed to sustain the new all-time high levels as investors started taking profits following outstanding returns in November and December.
The closest key weekly support is at 15,931, with resistance at an all-time high level at 16,971.Indicator-based Nasdaq 100 technical analysis suggests the market remains in a long-term uptrend. The 20-period moving average is above the 50-period SMI, with both moving averages trending upward.
More corrective price action ahead?
Despite last week's correction, the market is still relatively far from these moving averages, indicating the potential for continued corrective movement. Let's now analyse the daily timeframe and intraday charts to establish key price levels and outline scenarios for potential bullish and bearish price action.
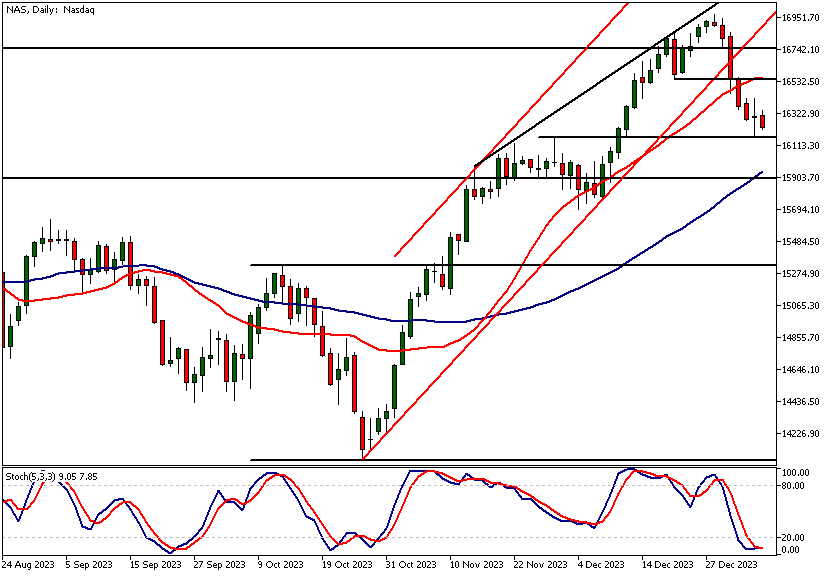
Daily Nasdaq 100 Technical Analysis
In the daily NASDAQ chart, a narrow-range candle emerged after the release of NFP numbers on Friday. The candle formation is known as Doji and signifies indecision and could indicate a potential reversal of the market's previous direction.
In general, when a Doji forms at a support level (16,165), it suggests the downward movement might have concluded, and the market is attempting an upward move.
If there's a clear rally above Friday's high (16,418), it may indicate a resumption of the uptrend. Conversely, if the market breaches the 16,165 support level, a downward move towards the 50-period moving average (currently at 15,946) might ensue.
Potential stochastic oscillator buy signal
Indicator focused Nasdaq 100 technical analysis suggests potential bullishness as the stochastic oscillator is about to give a buy signal while in the oversold region. This reinforces the notion that the market has lost downward momentum at a support level.
In the context of an uptrend, this provides a bullish signal that the market may indeed ascend from its current position. However, this is contingent on the market not violating Friday's low at 16,176 and decisively trading above Friday's high at 16,418.
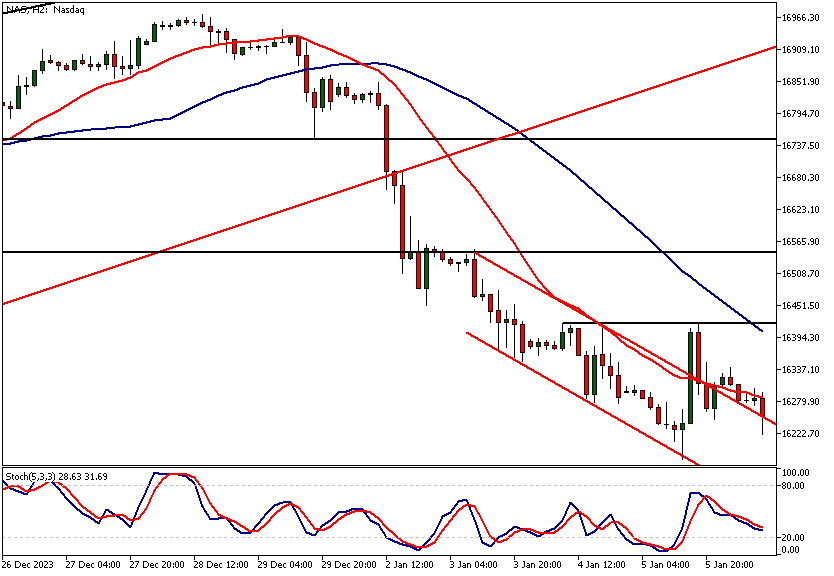
Intraday Nasdaq 100 Technical Analysis
In the two-hour chart, the market has broken out of a descending trend channel. However, the rally was halted at a minor resistance level at 16,420, closely aligned with the 50-period moving average.
Currently, the market is trading near the channel high, and Nasdaq 100 technical analysis suggests that a higher swing low above Friday's low (16,176) would be bullish. This scenario would be bullish and increase the likelihood of the market breaking above the 16,420 resistance level.
In case of a decisive breakthrough, anticipate a move towards 16,551, possibly followed by a continued rally to 16,750. On the other hand, if there's a breach below Friday's low, we may witness the market descending to 15,946.
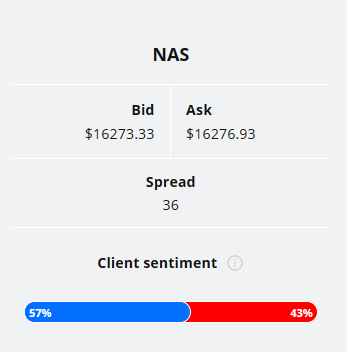
Client sentiment analysis
57% of clients trading Nasdaq are holding long positions, while 43% are holding short positions. Client sentiment data is being provided by TIO Markets Ltd.
It’s good to remember that retail client trading sentiment is a contrarian indicator as most retail traders are on average trading against market price trends. This is why experienced traders tend to trade against the retail client sentiment. You can follow the TIOmarkets client sentiment live on our Forex dashboard.
The next key risk events for this market
- 10-y Bond Auction
- Core CPI m/m
- CPI m/m
- CPI y/y
- Unemployment Claims
- 30-y Bond Auction
- Core PPI m/m
- PPI m/m
Potential Nasdaq 100 Market Moves
In a bullish scenario, surpassing 16,418 on the daily chart could resume the uptrend, with potential targets at 16,551 and 16,750. Conversely, a bearish outcome would see a breach below 16,165, potentially leading to a decline towards the 50-period moving average at 15,946.

How Would You Trade The Nasdaq 100 Today?
I hope this Nasdaq 100 technical analysis helps you to make better informed trading decisions. Check the latest market analysis for other instruments and subscribe to receive them in your inbox as soon as they are published
While research has been undertaken to compile the above content, it remains an informational and educational piece only. None of the content provided constitutes any form of investment advice.
TIO Markets UK Limited is a company registered in England and Wales under company number 06592025 and is authorised and regulated by the Financial Conduct Authority FRN: 488900
Risk warning: CFDs are complex instruments and come with a high risk of losing money rapidly due to leverage. 73% of retail investor accounts lose money when trading CFDs with this provider. You should consider whether you understand how CFDs work and whether you can afford to take the high risk of losing your money. Professional clients can lose more than they deposit. All trading involves risk.
DISCLAIMER: TIO Markets offers an exclusively execution-only service. The views expressed are for information purposes only. None of the content provided constitutes any form of investment advice. The comments are made available purely for educational and marketing purposes and do NOT constitute advice or investment recommendation (and should not be considered as such) and do not in any way constitute an invitation to acquire any financial instrument or product. TIOmarkets and its affiliates and consultants are not liable for any damages that may be caused by individual comments or statements by TIOmarkets analysis and assumes no liability with respect to the completeness and correctness of the content presented. The investor is solely responsible for the risk of his/her investment decisions. The analyses and comments presented do not include any consideration of your personal investment objectives, financial circumstances, or needs. The content has not been prepared in accordance with any legal requirements for financial analysis and must, therefore, be viewed by the reader as marketing information. TIOmarkets prohibits duplication or publication without explicit approval.

Janne Muta holds an M.Sc in finance and has over 20 years experience in analysing and trading the financial markets.
