Risk disclaimer: 76% of retail investor accounts lose money when trading CFDs and Spreadbets with this provider. You should consider whether you understand how CFDs and Spreadbets work and whether you can afford to take the high risk of losing your money.
Gold analysis | Gold rallies $22 after a bullish breakout
BY Janne Muta
|August 24, 2023Our gold analysis focuses on both the market gold technical analysis and fundamentals in the US economy. While the Federal Reserve's immediate response has been to raise rates, broader market sentiments anticipate a future dovish turn with no rate hike in September and a rate cut in June next year.
This, combined with inflationary pressures, may lead to a flattening of the US bond market's yield curve. Concurrently, the USD could face medium to long-term declines.
Gold indicates that such economic conditions, especially a weakening USD, could benefit gold. The next key risk events impacting USD and therefore probably the price of gold are US Unemployment Claims, US Core Durable Goods Orders, US Durable Goods Orders, US FOMC Member Harker's Speech and the Jackson Hole Symposium.
Gold technical analysis
Gold weekly chart analysis
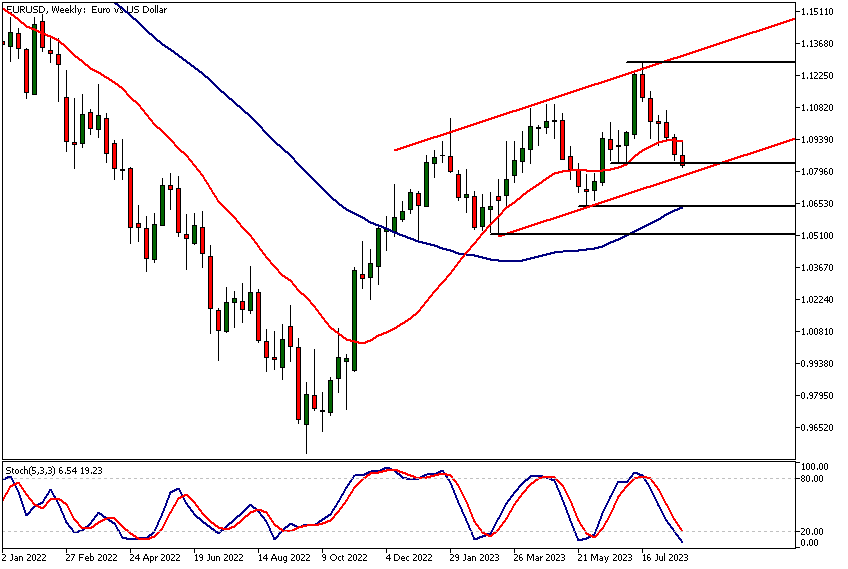
Gold is still in a downtrend in the weekly chart. The market attracted buyers near the 38.2% retracement level that coincided with a weekly low. The current contra trend move is could slow down when the market reaches the bear channel top (currently at 1947).
Gold analysis of daily chart
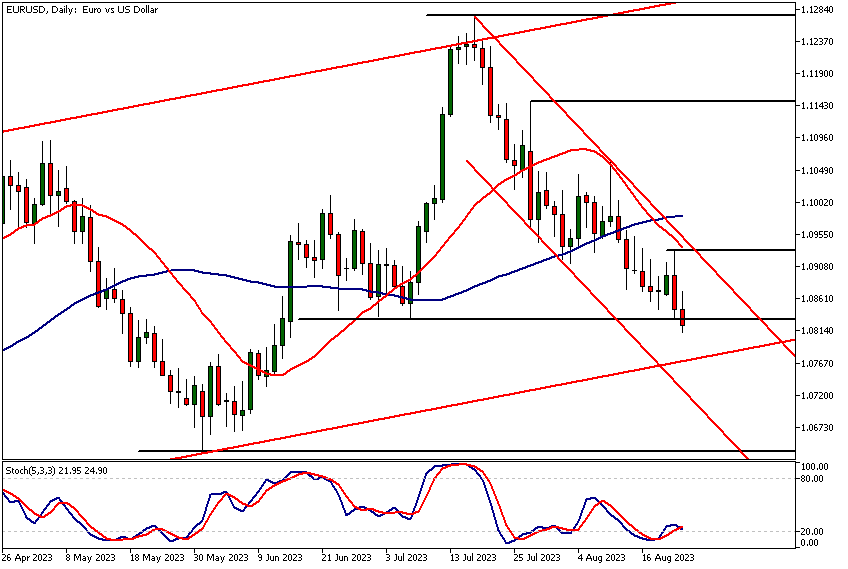
Gold has rallied nicely (22 dollars) since breaking out of the bearish channel in the daily chart. This bullish breakout has taken the market to the 38.2% retracement level (calculated from the March high to the recent low).
Our gold analysis shows that gold rising this fast is due to USD weakness and rallying T-Bond market. If the market maintains the current upside momentum look for a move to 1943 or so. Otherwise the market might trade down to 1903.
XAUUSD chart, 4h technical analysis
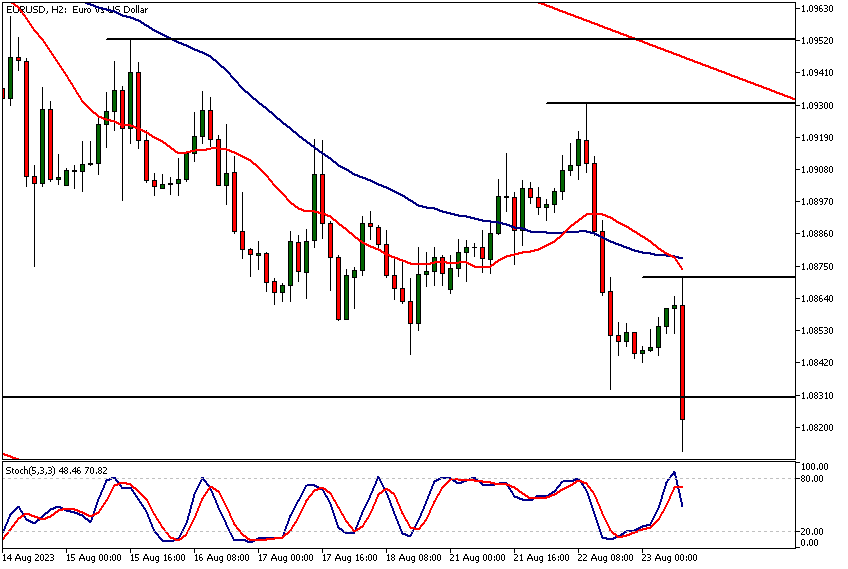
In the 4h XAUUSD chart we can see how the market has lost some momentum after hitting a resistance level 1920.90. Fundamental gold analysis and the recent momentum in the daily XAUUSD chart suggest that the marker could still have upside potential.
This however, doesn't mean gold has to keep on rallying higher without retracing lower first. Simple gold technical analysis shows that the nearest key support level in the 4h XAUUSD chart is at 1914. If the level is broken decisively the market could retrace back to the 20 and 50 period moving averages. If the level holds though, look for a continuation in the rally.
Client sentiment analysis
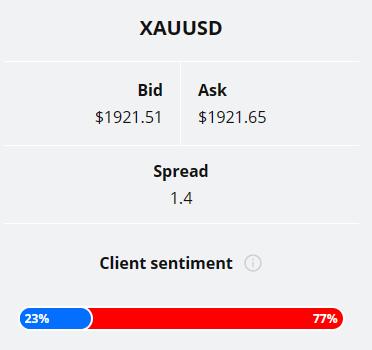
TIOmarkets' clients are currently positioned bearishly on XAUUSD with 77% of the clients being short gold. It’s good to remember that the retail trader client sentiment is a contrarian indicator as most of the retail traders are on average betting against the market trends. This is why, experienced traders tend to trade against the retail client sentiment. You can follow the TIOmarkets client sentiment live on our Forex dashboard.

Gold fundamental analysis
Gold analysis and the bond market correlation
XAUUSD analysis often mirrors the intricacies of the US bond market, given the correlation between the bond prices and XAUSD. When the price of bonds moves higher the yields decline.
This pressures the dollar and to a certain extent supports the price of gold. This is why it makes sense to analyse the main drivers of the US bond market to understand the fundamental drivers for XAUSD and support our gold analysis.
Key factors influencing U.S. bond prices
U.S. bond prices are influenced by a constellation of factors, chief among them being interest rates set by the Federal Reserve. Generally, as interest rates rise, bond prices fall and vice versa, due to the relative attractiveness of new versus existing bonds.
Inflation expectations also play a crucial role; anticipated inflation erodes the real value of fixed bond payments, leading to potential price decreases. The broader economic landscape is pivotal too; in uncertain times, the safety of US government bonds becomes enticing, driving up prices.
Conversely, in a flourishing economy, the allure of riskier assets might dampen bond demand and prices. Supply and demand dynamics, influenced by bond issuance and buybacks, are foundational in determining bond valuations.
Lastly, global geopolitical tensions can prompt a "flight-to-quality", with investors seeking refuge in U.S. bonds, bolstering their prices. These drivers collectively shape the intricate landscape of the U.S. bond market.
XAUUSD analysis in light of US economic indicators
Comprehensive gold analysis needs to take into account the trends in the US economic indicators. With rigorous gold analysis, we can shed light on the nation's economic health and the likely future trends of the bond market, the USD and the price of gold. These insights can be pivotal as we on a daily basis look to answer the question: is xauusd today buy or sell?
Recent inflation trends
In July 2023, the core consumer price inflation rate, a metric frequently cited in gold technical analysis and fundamental analysis alike due to its correlation with gold prices, saw a decrease.
Excluding volatile components like food and energy, the rate stood at 4.7%, its nadir since October 2021. This was a modest drop from the 4.8% recorded in the preceding month, and marginally below market forecasts.
Concurrently, July witnessed a 0.2% monthly surge in core consumer prices, mirroring the growth observed in June and aligning seamlessly with market projections.
Further, in our XAUUSD analysis, we focus on Core PCE prices, which, excluding food and energy costs, reported a 0.2% increment in June 2023. This was a slight moderation from the 0.3% expansion of the previous month. Annually, the Federal Reserve's data indicated that this rate, their favoured inflation metric, escalated to 4.1%.
This was its lowest since September 2021 and marginally below the market's prediction of 4.2%. When including food and energy, the PCE price index showed a 0.2% monthly rise and 3% annually, notably the most modest since March 2021.
Inflation expectations and gold analysis
Shifting the focus to inflation expectations, the University of Michigan's estimates for the United States presented a detailed picture. Their projections, foundational in comprehensive gold analysis, suggested a 3.3% inflation rate for the upcoming year in August 2023, down from 3.4% in July. Additionally, their five-year forecast in August 2023 touched a five-month low of 2.9%, a minor decrease from the 3% observed in July. In parallel, the inflation expectations of US consumers for the forthcoming year have consistently declined, reaching 3.5% in July 2023, the lowest since April 2021.
Federal reserve's stance and its impact on gold analysis
The Federal Reserve, central to gold analysis dialogues, adjusted the federal funds rate's target range in July 2023. Elevating it by 25 basis points, it now lies between 5.25% and 5.5%. This adjustment has pushed borrowing costs to a peak not witnessed since January 2001. Recent discussions within the Fed suggest that officials are increasingly concerned about potential inflationary threats, indicating they might consider additional policy tightening. So, the Federal Reserve stays hawkish but promises to adapt monetary policies based on fresh economic data.
Employment figures
On the employment front, there was some positive movement. The unemployment rate in July 2023 registered at 3.5%, a decline from the prior 3.6%, and slightly above the market predictions. Unemployed individuals saw a decrease by 116,000, with employment figures surging by 268,000. The comprehensive U-6 unemployment rate, accounting for part-time workers and those disengaged from job searches, also reported a reduction, settling at 6.7%. Concurrently, the labour force participation rate remained steady at 62.6%, its apex since March 2020.
For more analysis on US economy visit our USDCAD analysis report.
Conclusion
Based on the above data, the US economy appears to be showing signs of inflationary pressures, with metrics like the core consumer price inflation rate and the core PCE price index indicating elevated levels, albeit with some metrics showing a downward trend.
The Federal Reserve's decision to raise the federal funds rate and the ongoing concerns about inflationary threats suggest that the central bank is already acting on these pressures. Gold analysis indicates that such decisions from the Federal Reserve can have ripple effects on gold prices.
Market expectations, gold analysis, and the federal reserve's future stance
Given the market expectation that the Fed will not be hiking rates in September, as evidenced by the low probability priced in by the Fed Funds Futures traders, and the implied likelihood of a rate cut in June of the following year, it suggests that the longer-term outlook is one of softer economic conditions.
Gold analysis often takes into account these market expectations, given the intricate relationship between interest rates and gold prices.
Implications for the US bond market
For the US bond market, this mixed inflationary outlook combined with a potentially dovish Fed stance in the future might result in a flattening of the yield curve.
Short-term yields could see some upward pressure due to immediate inflationary concerns, while longer-term yields might be dampened by expectations of a softer economic stance and potential rate cuts. This could be beneficial for bond prices, especially for long-term bonds.
Outlook for the USD
The USD might face some downward pressure in the medium to long term. Initially, the inflationary concerns and the recent rate hike would support the USD.
However, as market participants adjust their expectations towards a more dovish Fed stance in the future, this would likely exert downward pressure on the currency. Furthermore, gold analysis suggests that a weakening USD typically bolsters the price of gold.
Gold analysis
Considering XAUUSD (Gold priced in US Dollars), traditionally, gold has been seen as a hedge against inflation. The current inflationary pressures would support the price of gold. Moreover, a potentially weaker USD due to future rate cuts would also make gold, which is dollar-denominated, more attractive, pushing its price higher.
Thus, based on the provided data and market expectations, the XAUUSD is more likely to see support rather than pressure in the medium to long term.
The next main risk events
- USD Unemployment Claims
- USD Core Durable Goods Orders
- USD Durable Goods Orders
- USD FOMC Member Harker Speaks
- ALL FX Jackson Hole Symposium
- JPY Tokyo Core CPI
- EUR German ifo Business Climate
- USD FOMC Member Harker Speaks
- USD FOMC Member Harker Speaks
- USD Revised UoM Consumer Sentiment
- USD Fed Chair Powell Speaks
- All Jackson Hole Symposium
- EUR ECB President Lagarde Speaks
For more information and details see the TIOmarkets economic calendar.
While research has been undertaken to compile the above content, it remains an informational and educational piece only. None of the content provided constitutes any form of investment advice.
Tio Markets UK Limited is a company registered in England and Wales under company number 06592025 and is authorised and regulated by the Financial Conduct Authority FRN: 488900
Risk warning: CFDs are complex instruments and come with a high risk of losing money rapidly due to leverage. 82% of retail investor accounts lose money when trading CFDs with this provider. You should consider whether you understand how CFDs work and whether you can afford to take the high risk of losing your money. Professional clients can lose more than they deposit. All trading involves risk.
DISCLAIMER: Tio Markets offers an exclusively execution-only service. The views expressed are for information purposes only. None of the content provided constitutes any form of investment advice. The comments are made available purely for educational and marketing purposes and do NOT constitute advice or investment recommendation (and should not be considered as such) and do not in any way constitute an invitation to acquire any financial instrument or product. TIOmarkets and its affiliates and consultants are not liable for any damages that may be caused by individual comments or statements by TIOmarkets analysis and assumes no liability with respect to the completeness and correctness of the content presented. The investor is solely responsible for the risk of his/her investment decisions. The analyses and comments presented do not include any consideration of your personal investment objectives, financial circumstances, or needs. The content has not been prepared in accordance with any legal requirements for financial analysis and must, therefore, be viewed by the reader as marketing information. TIOmarkets prohibits duplication or publication without explicit approval.

Janne Muta holds an M.Sc in finance and has over 20 years experience in analysing and trading the financial markets.
