Risk disclaimer: 76% of retail investor accounts lose money when trading CFDs and Spreadbets with this provider. You should consider whether you understand how CFDs and Spreadbets work and whether you can afford to take the high risk of losing your money.
GBPNZD analysis | GBPNZD at a pivotal level after a 3.3% fall
BY Janne Muta
|September 28, 2023Our GBPNZD analysis report reveals the market trading at a pivotal juncture as it has declined to a technical confluence area that aligns with the 61.8% Fibonacci retracement level. This area also intersects with significant market structure levels that previously acted as resistance but now serve as potential support.
Oversold Condition in Varying Timeframes
The stochastic oscillator on this time frame suggests an oversold condition, pointing to the possibility of a price reversal or at least a pause in the prevailing downtrend. It becomes crucial, therefore, to closely monitor price action in the coming days.
Daily Chart Analysis of GBPNZD
Switching to the daily chart, GBPNZD has recently shown some signs of rebounding from the confluence zone highlighted in the weekly analysis. However, the bearish momentum remains strong in the daily timeframe, as evidenced by a 3.3% decline over the past two weeks.
Role of Moving Averages
The 20-period moving average crossing below the 50-period one reinforces this bearish outlook. Despite the short-term uptick, the potential for further decline or consolidation cannot be discounted. Additionally, the stochastic oscillator has remained in the oversold zone for several days, offering no solid directional clues.
4-Hour Chart, Immediate Resistance Levels
The 4-hour chart maintains the bearish narrative but introduces the possibility of the market moving sideways above the confluence zone. Resistance levels are clearly marked, and the stochastic oscillator indicates continued bearish sentiment.
The key risk events for GBPNZD are
- UK GPD
- S&P Global/CIPS Manufacturing PMI Final
- RBNZ Interest Rate Decision
- S&P Global/CIPS Services PMI Final SEP
Read the full GBPNZD analysis report below.
GBPNZD analysis
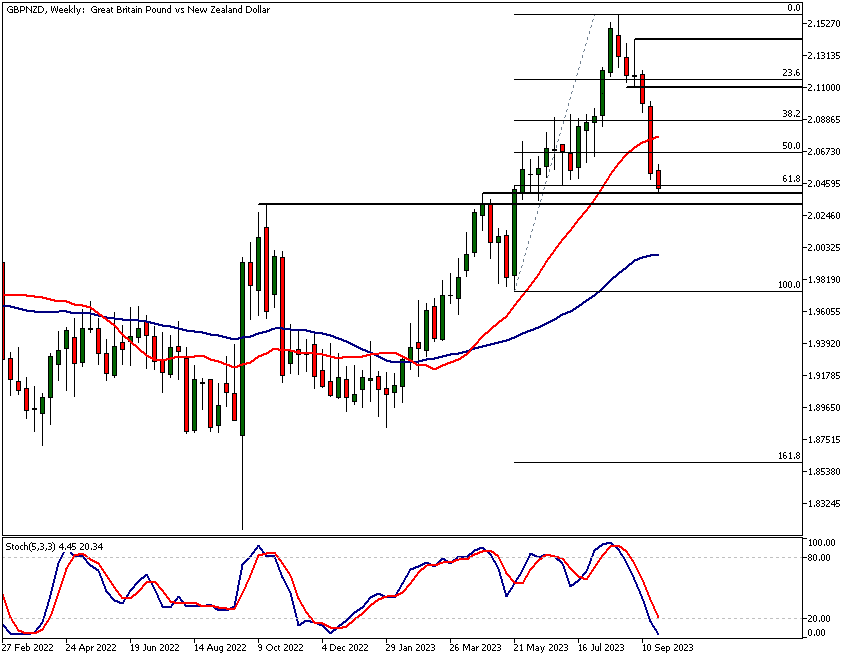
Weekly GBPNZD analysis
In the weekly chart, GBPNZD has reached a highly important pivotal area, declining to the technical confluence area that coincides with the 61.8% Fibonacci retracement level (2.0450).
Two significant market structure levels at 2.0317 and 2.0393 are closely aligned with the 61.8% Fibonacci retracement level. GBPNZD analysis shows that these levels previously resisted rallies in October 2022 and April 2023. Their roles have now reversed, and they act as support levels.
Stochastic Oscillator Insights
The stochastic oscillator has entered an oversold zone, registering a value of 4.37 at the time of writing. This indicates that GBPNZD is deeply oversold in the weekly time frame.
Importance of Monitoring Price Action
Given that this oversold condition is manifesting at major weekly support levels, it is crucial to monitor price action closely and update our GBPNZD analysis in the coming days.
Additionally, the 20 and 50-period moving averages maintain a bullish orientation, with the faster moving average positioned above the slower one.
Confluence Zone and Buyer Attraction
Should GBPNZD fail to attract buyers within this confluence zone—formed by the market structure levels and the 61.8% Fibonacci retracement—the likelihood of further decline increases.
Potential Outcomes and Price Targets
As per our GBPNZD analysis, a decisive breach of the lower end of this zone at 2.0317 could send GBPNZD down to 2.0150. On the flip side, if bulls manage to push GBPNZD higher from this point, a move towards 2.0842 becomes plausible.
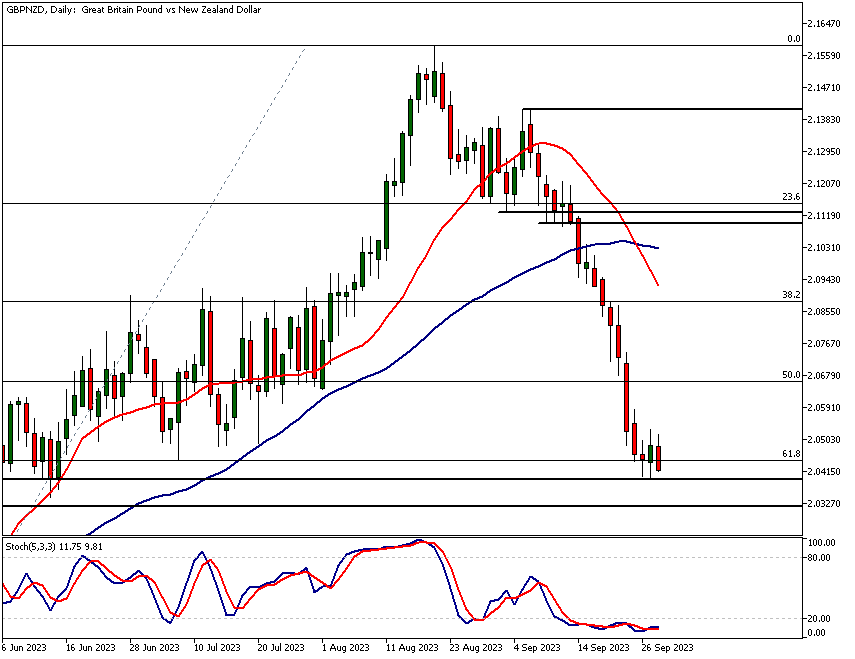
Daily GBPNZD technical analysis
Turning to the daily chart, it reveals that GBPNZD has rebounded from the confluence area identified in the weekly GBPNZD analysis. Despite this, the downside momentum remains strong, with approximately a 3.3% decline over the past two weeks. Such strong momentum implies that GBPNZD is unlikely to turn on a dime.
Short-Term Price Movement and Market Sentiment
Even though GBPNZD traded higher yesterday, the potential for further decline or consolidation remains significant. According to GBPNZD analysis, the crossing of the 20-period moving average below its 50-period counterpart—both pointing downwards—suggests that a bearish outlook might prevail.
Oscillator Dynamics and Market Direction
The stochastic oscillator has remained in the oversold territory for several days, offering no strong directional cues at this time. This aspect underscores the importance of considering other factors in GBPNZD analysis.
Key Resistance and Support Levels
The nearest significant resistance area is located between 2.1100 and 2.1146. This zone is particularly noteworthy as it coincides with two market structure levels and a 23.65% retracement level. Concurrently, the closest support level below the confluence zone (ranging from 2.0137 to 2.0450) is identified at 2.0160.
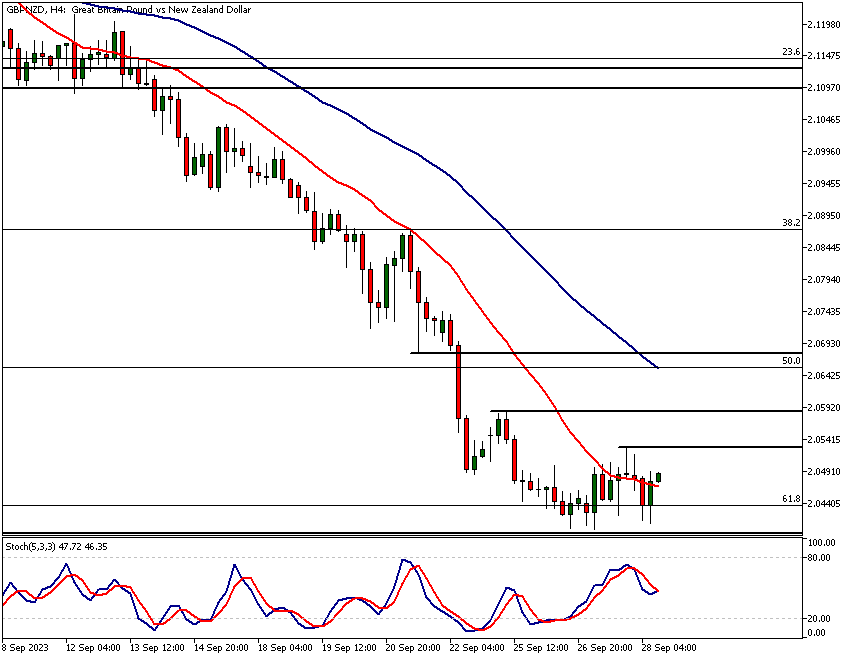
4h GBPNZD technical analysis
In the 4-hour chart, GBPNZD created lower reactionary highs and lower lows, thereby affirming that the downtrend persists. At the same time though, there are first signs of the market possibly starting to move sideways above the confluence zone. Note, that the nearest key resistance levels are at 2.0529 and 2.0583.
Technical Confluence Zone
GBPNZD analysis indicates that even if the pair manages to break these initial resistance levels, it probably tests the technical confluence zone at 2.0662 - 2.0769.
This zone is particularly significant as the 50-period moving average and the 50% Fibonacci retracement closely align at this level. The zone also includes a market structure level at 2.0679.
Moving Averages and Market Sentiment
Both moving averages in this 4-hour time frame are pointing lower and are arranged in a bearish sequence, with the 20-period SMA situated below the 50-period SMA.
GBPNZD analysis, employing the Stochastic Oscillator, suggests an ongoing bearish sentiment. The oscillator has recently signalled a sell, and GBPNZD has responded by trading lower, creating the latest lower reactionary high at 2.0583.
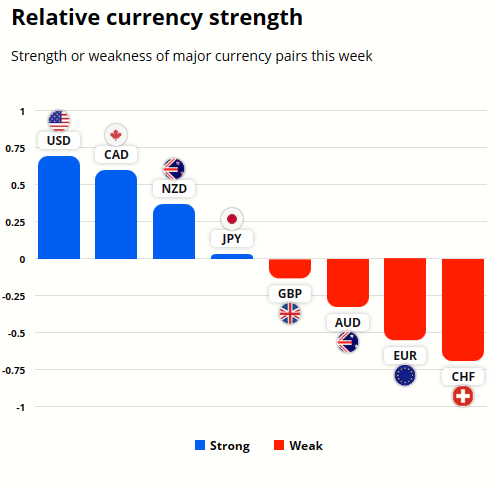
GBP and NZD currency strength analysis
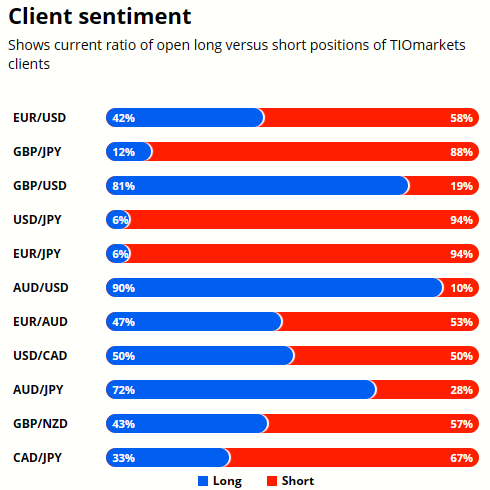
TIOmarkets clients are slightly more bearish than bullish on GBPNZD with 57% of the client base short the currency pair while 43% are holding long positions.
To gain better understanding on the potential future price moves in these currencies refer to the GBPNZD analysis above.
Client sentiment analysis
TIOmarkets clients are strongly bearish on GBPNZD with 96% of the client base short the currency pair while only 4% are bullish on the market.
Please remember that the retail trader client sentiment is a contrarian indicator as most of the retail traders are on average betting against the market trends. This is why, experienced traders tend to trade against the retail client sentiment. You can follow the TIOmarkets client sentiment live on our Forex dashboard.
The key takeaways from this GBPNZD analysis report
- In the weekly GBPNZD chart, the currency pair has descended to a pivotal confluence area that matches the 61.8% Fibonacci retracement level at 2.0450. Market structure levels at 2.0317 and 2.0393 act as support, having previously acted as resistance in October 2022 and April 2023.
- The stochastic oscillator in the weekly timeframe for GBPNZD indicates an oversold condition, registering at 4.37. This signifies a deeply oversold market and necessitates close monitoring of price action for possible reversals or further decline.
- Despite GBPNZD rebounding in the daily chart, it's important to note a 3.3% decline over the past two weeks. The bearish momentum is confirmed by the 20-period moving average crossing below the 50-period moving average.
- For intra-day traders, significant resistance levels on the 4-hour GBPNZD chart are located at 2.0529 and 2.0583. The stochastic oscillator indicates continued bearish sentiment, signalling the latest lower reactionary high at 2.0583.
- The 4-hour chart shows a critical technical confluence zone between 2.0662 and 2.0769. This zone includes alignment of the 50-period moving average and the 50% Fibonacci retracement, making it a significant area for potential market action.
- Over the past week, GBP has underperformed against NZD, although the gap is narrowing. This is relevant to the broader bearish context for GBPNZD. For a more nuanced understanding of future price movements, refer to the detailed GBPNZD technical analysis above.

The next main risk events
- CAD - Employment Change
- CAD - Unemployment Rate
- CNY - CPI
- CNY - PPI
For more information and details see the TIOmarkets economic calendar.
While research has been undertaken to compile the above content, it remains an informational and educational piece only. None of the content provided constitutes any form of investment advice.
Tio Markets UK Limited is a company registered in England and Wales under company number 06592025 and is authorised and regulated by the Financial Conduct Authority FRN: 488900
Risk warning: CFDs are complex instruments and come with a high risk of losing money rapidly due to leverage. 82% of retail investor accounts lose money when trading CFDs with this provider. You should consider whether you understand how CFDs work and whether you can afford to take the high risk of losing your money. Professional clients can lose more than they deposit. All trading involves risk.
DISCLAIMER: Tio Markets offers an exclusively execution-only service. The views expressed are for information purposes only. None of the content provided constitutes any form of investment advice. The comments are made available purely for educational and marketing purposes and do NOT constitute advice or investment recommendation (and should not be considered as such) and do not in any way constitute an invitation to acquire any financial instrument or product. TIOmarkets and its affiliates and consultants are not liable for any damages that may be caused by individual comments or statements by TIOmarkets analysis and assumes no liability with respect to the completeness and correctness of the content presented. The investor is solely responsible for the risk of his/her investment decisions. The analyses and comments presented do not include any consideration of your personal investment objectives, financial circumstances, or needs. The content has not been prepared in accordance with any legal requirements for financial analysis and must, therefore, be viewed by the reader as marketing information. TIOmarkets prohibits duplication or publication without explicit approval.

Janne Muta holds an M.Sc in finance and has over 20 years experience in analysing and trading the financial markets.
