Risk disclaimer: 76% of retail investor accounts lose money when trading CFDs and Spreadbets with this provider. You should consider whether you understand how CFDs and Spreadbets work and whether you can afford to take the high risk of losing your money.
GBPCAD Analysis | Bullish ABCD Pattern in Progress?
BY Janne Muta
|October 12, 2023Our GBPCAD analysis shows the market in a promising rally following a weekly bullish exhaustion candle and a 2.5% market rise in the last fortnight from a low at 1.6357. The weekly chart reveals a potential classic return move post a bearish breakout, with strong momentum hinting at further bullishness in the market.
Resistance Levels and Possible Retracement
The nearest significant resistance level stands at 1.6858, close to the 20-period moving average at 1.6909. The GBPCAD analysis today suggests that traders eyeing the weekly chart might target this range, possibly triggering a market softening or retracement.
Bullish Outlook and Potential Downside
The market remains bullish with the 50-period moving average pointing upwards and the stochastic oscillator endorsing a buy, promoting a bullish outlook. Conversely, failing momentum could drag the market down to the 23.6% Fibonacci retracement level at 1.6538, a historically significant support level.
Daily and Four-Hour Chart Analysis
As per our GBPCAD analysis, the daily and 4-hour charts echo a bullish sentiment, albeit with caution advised near resistance levels.
Broader Economic Landscape
The broader economic landscape with a 0.2% growth in the UK economy in August 2023 looks to be improving but all in all the UK economy is currently experiencing a period of slow growth.
Monthly Growth Analysis and Market Reaction
The 0.2% month-over-month growth in August 2023 was a slight improvement from the revised 0.6% contraction in July, but it is still below the long-term average of around 0.5% per quarter. The GBPCAD market reaction to the data release earlier today was slightly bearish (0.12% at the time of writing this).
The next key risk events for GBPCAD are
- GBP - Unemployment Rate
- GBP - Average Earnings
- GBP - Employment Change
- CAD - Inflation Rate
Read the full GBPJPY technical analysis report below
GBPCAD analysis

Weekly GBPCAD analysis
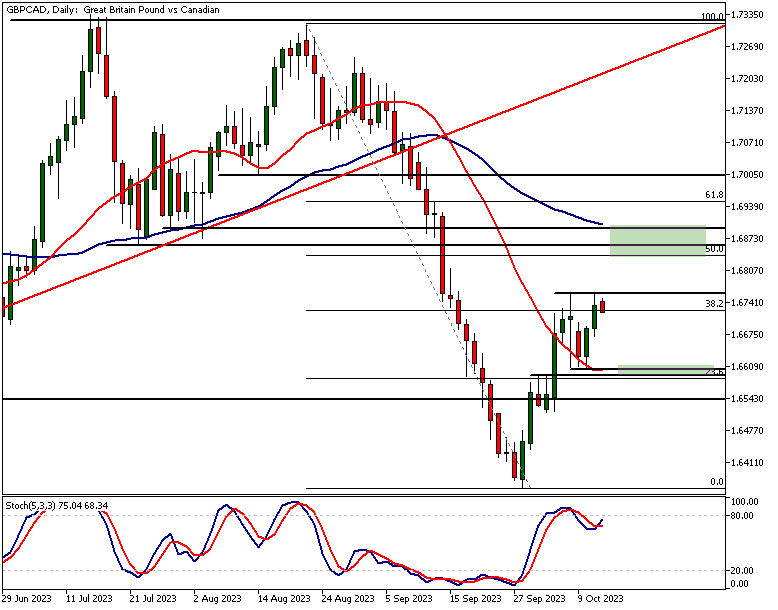
The weekly chart shows the market rallying higher after it created a bullish exhaustion candle two weeks ago. In just two weeks, the market has rallied approximately 2.5% since attracting buyers at 1.6357. Note how this low was exactly the measured move target based on the bull channel width.
Post-Breakout Rally Analysis
The market has since broken below the channel low but is currently trading higher which suggests that this rally might be a classical return move after a bearish breakout. GBPCAD analysis suggests the strong momentum candle that followed the weekly exhaustion candle indicates that the market could still move higher.
Anticipated Resistance Level
The next significant resistance level is at 1.6858 and roughly coincides with the 20-period moving average at 1.6909. Those trading based on the weekly chart might target this price range and offload some of their positions if the market moves to this area. This could soften the market and either slow the price advance down or create a retracement.
Indicators of Further Upside
The 50-period moving average is still pointing higher and the market is trading above the moving average (currently at 1.6644). The stochastic oscillator has given a buy signal and points higher, so GBPCAD analysis indicates we might see further advancement in the market.
Potential Retracement Scenario
If, however, the current bullish momentum fails, we should look for a move back down to the 23.6% Fibonacci retracement level. This level (1.6538) has some historical significance as the market has found support at this level in April this year and the high of the weekly exhaustion candle also aligns closely with this same price level. If the level fails to attract buyers, the market might trade down to 1.6357 which is the low established 2 weeks ago.
Daily GBPCAD analysis
The daily chart shows how the market has rallied, retraced and then started rallying again. The formation the market is now creating is known as a bullish ABCD formation. Therefore based on GBPCAD analysis, we might see further strength in the market.
Near-Term Support Levels
The nearest swing low roughly coincides with the 20-period moving average and a market structure level between 1.6588 and 1.6607. If the market retraces back to this level we could see the buyers engaging with it again. Should this happen look for price action confirmation before making any trading decisions.
Targeting Technical Confluence Area
Our GBPCAD analysis suggests that those are currently long GBPCAD could be targeting the next technical Confluence area Between 1.6836 and 1.6900. This confluence area is created by the 50% Fibonacci retracement level, a market structure level from July and the 50-period SMA. In order to reach this level the Bulls need to be obviously able to push the market above 1.6761 and maintain the levels above it.
GBPCAD analysis, 4h
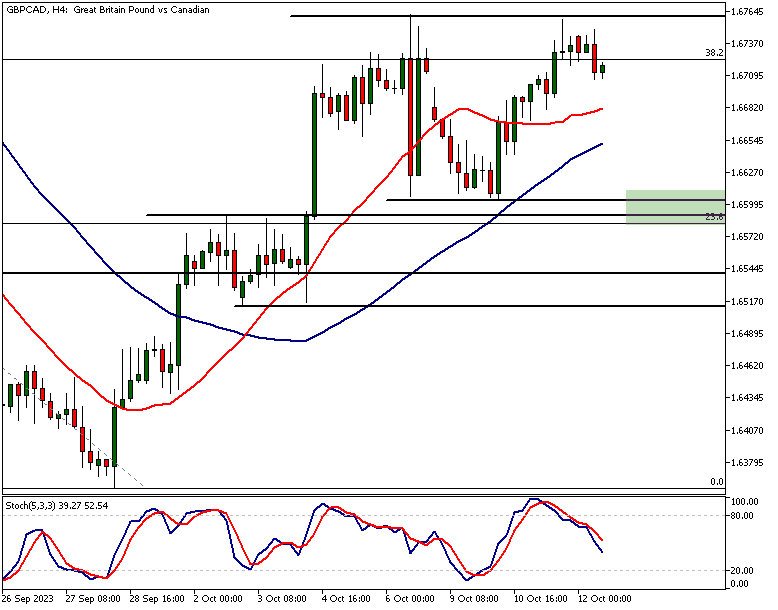
The 4-hour chart shows the market creating a double top at 1.6761. This is the upper end of the sideways range the market has been in since Friday last week. The lower end of the range is at 1.6607. The stochastic oscillator has given a sell signal and is pointing lower. This is an indication of momentum loss in the market near to the sideways range high.
Momentum and Moving Average Analysis
However, both moving averages are still pointing higher with the fast moving average above the slow. Our GBPAUD analysis therefore suggests that despite the range the market still could have an upside bias.
Confluence Area and Range Low
Note that the confluence area we talked about in the daily GBPCAD analysis is right below the range low. Therefore, the probability of the market breaking below this area (1.6588 and 1.6607) might be low. However, if this area is decisively violated, we might see the market moving down to 1.6514.

GBP and JPY Currency Strength Analysis
GBP is stronger than CAD while the CHF is the strongest currency and the JPY the weakest.
Client sentiment analysis
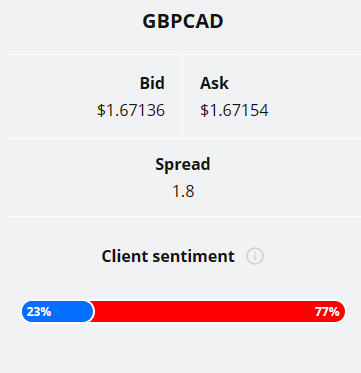
Majority of retail traders are bearish (77%) on GBPCAD currency pair. Only 23% are currently long the market.
Please remember that the retail trader client sentiment is a contrarian indicator as most of the retail traders are on average betting against the market trends. This is why, experienced traders tend to trade against the retail client sentiment. You can follow the TIOmarkets client sentiment live on our Forex dashboard.
The key takeaways from this report
- The GBPCAD weekly analysis indicates a promising rally following a bullish exhaustion candle, with a notable 2.5% market rise from a low of 1.6357. The momentum, coupled with a classic return move post a bearish breakout, hints at potential further bullishness in the market.
- The nearest significant resistance level is identified at 1.6858, proximate to the 20-period moving average at 1.6909. Traders eyeing the weekly chart might target this range, which could trigger a market softening or retracement, according to the GBPCAD analysis.
- Bullish indicators are present with the 50-period moving average pointing upwards and the stochastic oscillator endorsing a buy. However, failing momentum could drive the market down to the 23.6% Fibonacci retracement level at 1.6538, a historically significant support level.
- Daily and 4-hour GBPCAD charts echo bullish sentiments, albeit caution is advised near resistance levels. The formation known as a bullish ABCD formation on the daily chart suggests potential further strength in the market.
- The 4-hour chart highlights a double top at 1.6761, indicating a momentum loss near the sideways range high. Despite this, both moving averages still point higher suggesting an upside bias, although a decisive violation of the range low could lead to a downward movement.
- Majority of retail traders are bearish (77%) on the GBPCAD currency pair, with only 23% being long. This client sentiment is a contrarian indicator, often implying that experienced traders might opt to trade against the retail client sentiment, as per the GBPCAD analysis.
Read more analysis on GBP
Read more analysis on CAD
We hope that our GBPJPY technical analysis helps our readers to make better trading decisions!

The next main risk events
- USD - Core CPI m/m
- USD - CPI m/m
- USD - CPI y/y
- USD - Unemployment Claims
- CNY - CPI y/y
- CNY - PPI y/y
- GBP - BOE Gov Bailey Speaks
- EUR - ECB President Lagarde Speaks
- USD - FOMC Member Harker Speaks
- USD - Prelim UoM Consumer Sentiment
- USD - Prelim UoM Inflation Expectations
- GBP - BOE Gov Bailey Speaks
- EUR - ECB President Lagarde Speaks
For more information and details see the TIOmarkets economic calendar.
While research has been undertaken to compile the above content, it remains an informational and educational piece only. None of the content provided constitutes any form of investment advice.
Tio Markets UK Limited is a company registered in England and Wales under company number 06592025 and is authorised and regulated by the Financial Conduct Authority FRN: 488900
Risk warning: CFDs are complex instruments and come with a high risk of losing money rapidly due to leverage. 82% of retail investor accounts lose money when trading CFDs with this provider. You should consider whether you understand how CFDs work and whether you can afford to take the high risk of losing your money. Professional clients can lose more than they deposit. All trading involves risk.
DISCLAIMER: Tio Markets offers an exclusively execution-only service. The views expressed are for information purposes only. None of the content provided constitutes any form of investment advice. The comments are made available purely for educational and marketing purposes and do NOT constitute advice or investment recommendation (and should not be considered as such) and do not in any way constitute an invitation to acquire any financial instrument or product. TIOmarkets and its affiliates and consultants are not liable for any damages that may be caused by individual comments or statements by TIOmarkets analysis and assumes no liability with respect to the completeness and correctness of the content presented. The investor is solely responsible for the risk of his/her investment decisions. The analyses and comments presented do not include any consideration of your personal investment objectives, financial circumstances, or needs. The content has not been prepared in accordance with any legal requirements for financial analysis and must, therefore, be viewed by the reader as marketing information. TIOmarkets prohibits duplication or publication without explicit approval.

Janne Muta holds an M.Sc in finance and has over 20 years experience in analysing and trading the financial markets.
