Risk disclaimer: 76% of retail investor accounts lose money when trading CFDs and Spreadbets with this provider. You should consider whether you understand how CFDs and Spreadbets work and whether you can afford to take the high risk of losing your money.
CADCHF technical analysis | Weakness After a Weekly Shooting Star?
BY Janne Muta
|October 4, 2023CADCHF technical analysis report - After a significant decline of 17.4% from May 2022 to July 2023, the CADCHF currency pair has shown signs of recovery, rallying nearly 6%. This uptick has catapulted the market out of a bearish trend channel to a critical technical level marked by the 38.2% Fibonacci retracement and a reactionary high from July.
Stochastic Oscillator and Overbought Condition
Notably, the stochastic oscillator crossed the 80-level, signalling an overbought condition. However, this surge was short-lived, as evidenced by a bearish shooting star candle formation on the weekly chart.
SMAs & Momentum Indicators
Concurrently, the market is navigating below a descending 50-period moving average, while the 20-period moving average shows a slight upward trajectory, indicating lost downside momentum.
Importance of Technical Levels
Our CADCHF technical analysis offers both bullish and bearish scenarios, ahead of several key risk events in CAD and CHF, making it crucial for traders to carefully read this report and closely observe the technical levels highlighted in this report.
The CADCHF technical analysis report, key takeaways:
- The CADCHF pair rallied to a critical level at the 38.2% Fibonacci retracement, intersecting with a reactionary high from July. The stochastic oscillator crossed the 80 level, signifying an overbought market condition.
- The weekly chart showcased a bearish shooting star candle, suggesting potential downside. The market is currently below the 50-period moving average, which is pointing downwards.
- On the daily chart, the stochastic oscillator reads at 15, well below the 20-level threshold for oversold conditions. This indicates potential rallies could be selling opportunities.
- If the market forms a lower high below last week's 0.6823, it's likely to descend to the 0.6618 support level. A move above 0.6823 could propel the market to around 0.6934, aligning with the 50% Fibonacci level.
- In the 4-hour chart, the market is trapped in a bearish channel, with a high at 0.6731 coinciding with a descending 20-period MA. Resistance and support levels are identified at 0.6750 and 0.6658, respectively.
- For bullish momentum, the market needs to break above the 0.6750 resistance level. Failure to do so could lead to a decline towards the 0.6658 support level in the 4-hour chart.
The next key risk events for CADCHF are
- CAD - Balance of Trade
- CAD - Ivey PMI
- CAD - Unemployment Rate
- CHF - Unemployment Rate
Read the full CADCHF technical analysis report below.
CADCHF technical analysis
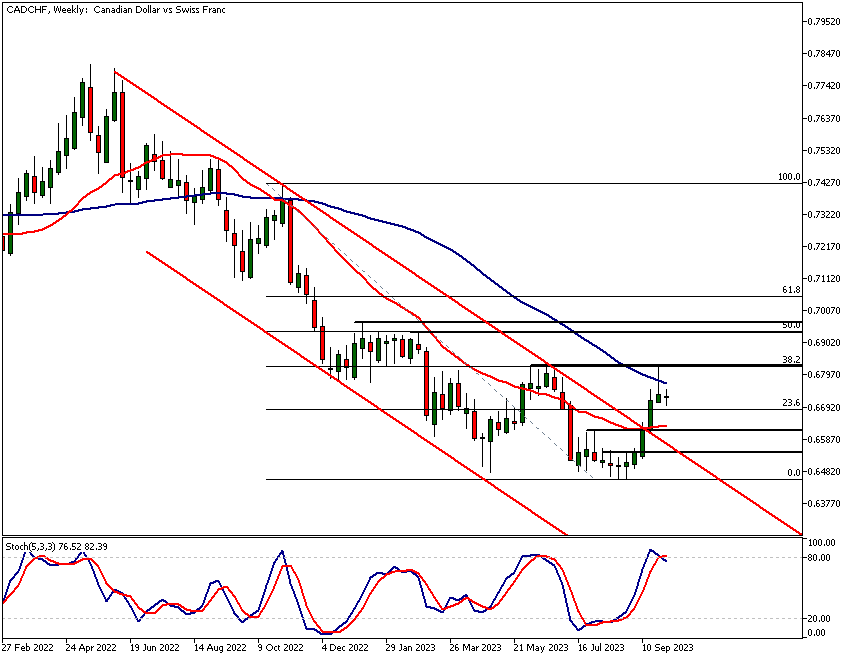
CADCHF technical analysis, weekly chart
After declining 17.4% from its high in May 2022 to its low in July 2023, the CADCHF currency pair has rallied nearly 6%, breaking out of a bearish trend channel. This rally propelled the market to a highly significant technical level, where the 38.2% Fibonacci retracement level and a reactionary high from July intersect.
Overbought Condition
The move was so robust that the stochastic oscillator exceeded the 80 level, indicating that the market had become overbought in terms of both the stochastic oscillator and market structure analysis. Consequently, it was unsurprising that the move was rejected last week, and CADCHF technical analysis shows how the market formed a bearish shooting star candle on the weekly timeframe chart.
Moving Averages: Contradicting Signals
The market is currently trading below the 50-period moving average, which continues to point lower. Simultaneously, the 20-period moving average is beginning to ascend. This bullish convergence of the moving averages suggests that the market has lost considerable downside momentum.
Trader Behaviour
Indeed, the CADCHF currency pair has been moving in a sideways range since April of this year. The recent weakness we have observed in this market is likely attributable to traders taking profits at the upper end of this weekly range between 0.6459 and 0.6831.
Bearish Shooting Star Candle
Our CADCHF technical analysis suggests, especially after the bearish shooting star candle was formed last week, that the market could decline to around 0.6618, a level roughly in line with the current 20-period moving average of 0.6633. However, if the bulls succeed in pushing the market beyond last week's high of 0.6823, we could anticipate a move to approximately 0.6934, a level closely aligned with the 50% Fibonacci retracement, forming a significant technical confluence level.
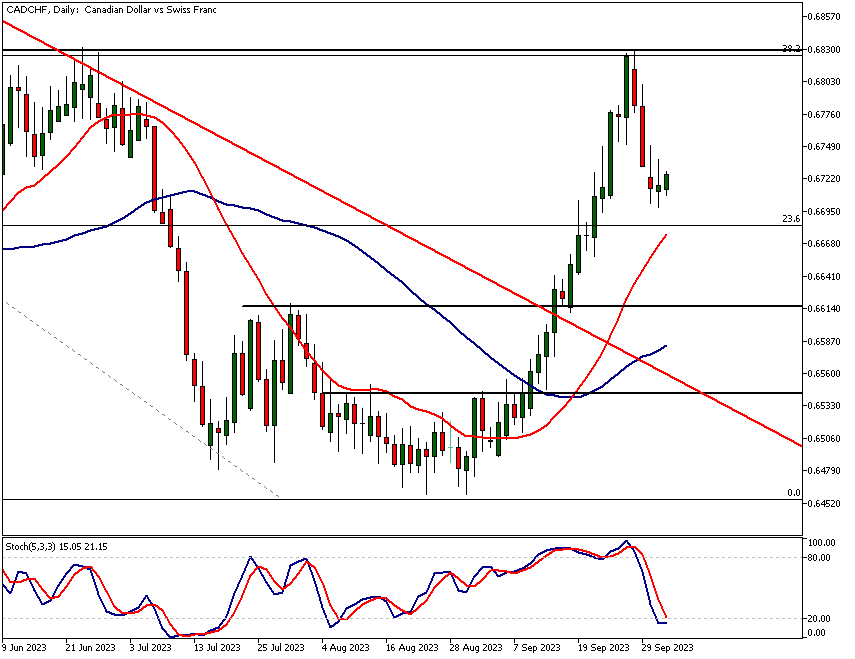
CADCHF technical analysis, daily chart
The daily chart reveals that the market declined for three consecutive days before becoming oversold as per the stochastic oscillator. Yesterday was a sideways trading day with minor gains. This loss of downside momentum could indicate that the bulls are attempting to push the market higher.
Daily Stochastic Oscillator Reading
The stochastic oscillator is currently at 15, well below the 20 level, which is considered the threshold for an oversold condition. As per our CADCHF technical analysis, the weakness displayed on the weekly chart suggests that potential rallies on the daily timeframe could serve as selling opportunities.
Scenarios for Market Direction
Therefore, if the market rallies and forms a lower reactionary high below last week's high of 0.6823, the likelihood of the market descending to the 0.6618 support level increases. The more bullish scenario would involve the daily moving averages pointing upwards, with the fast 20-period moving average crossing above the slow 50-period moving average.
Requirements for a Bullish Outcome
However, for a bullish outcome, the market would need to sustain levels above 0.6830, otherwise, it is likely to remain weak or continue trading within the range referred to in our weekly CADCHF technical analysis.
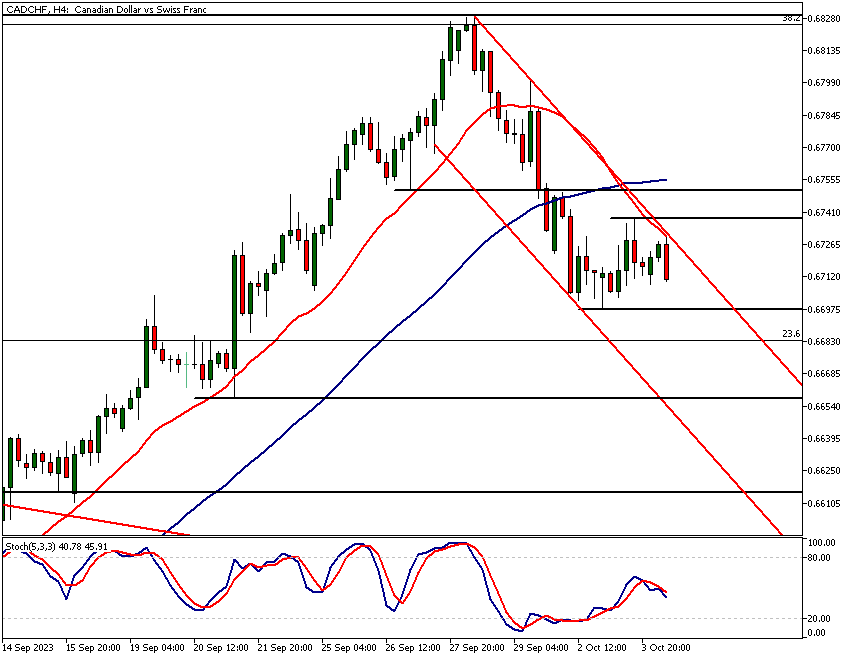
CADCHF technical analysis, 4h chart
In the 4-hour chart, the market appears to be confined within a bearish price channel. The channel's high at 0.6731 coincides with the descending 20-period moving average. Key market structure levels in the 4-hour chart are 0.6698, 0.6738, and 0.6750. Note that the 50-period moving average, currently at 0.6755, is somewhat aligned with the 0.6750 resistance level.
Conditions for Bullish Momentum
For bullish momentum to be established, the market needs to break above this level, potentially propelling it towards 0.6800. However, it is crucial for the bulls to eventually push the market above 0.6830 to exit the sideways range.
Should they fail to do so, CADCHF technical analysis indicates, a move down to the next key support level in the 4-hour chart at 0.6658 can be expected.

NZD and CHF currency strength analysis
CHF has been slightly stronger this week than CAD. This could continue if the weekly shooting star identified in our weekly CADCHF technical analysis continues to dominate market sentiment over the coming days.
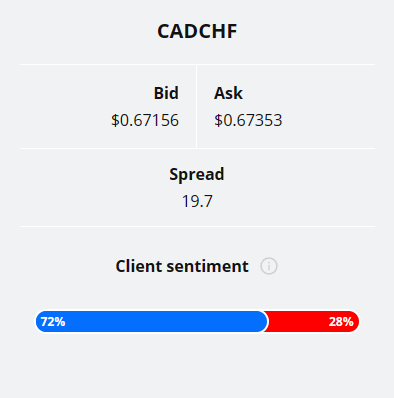
Over two-thirds (72%) of the TIOmarkets' client base is currently long CADCHF currency pair with 28% of the clientele holding short positions.
Please remember that the retail trader client sentiment is a contrarian indicator as most of the retail traders are on average betting against the market trends. This is why, experienced traders tend to trade against the retail client sentiment. You can follow the TIOmarkets client sentiment live on our Forex dashboard.

The next main risk events
- USOIL - OPEC-JMMC Meetings
- USD - ADP Non-Farm Employment Change
- USD - ISM Services PMI
- EUR - ECB President Lagarde Speaks
- GBP - Construction PMI
- USD - Unemployment Claims
- CAD - Ivey PMI
- CHF - Foreign Currency Reserves
- CAD - Employment Change
- CAD - Unemployment Rate
- USD - Average Hourly Earnings m/m
- USD - Non-Farm Employment Change
- USD - Unemployment Rate
- USD - FOMC Member Waller Speaks
For more information and details see the TIOmarkets economic calendar.
While research has been undertaken to compile the above content, it remains an informational and educational piece only. None of the content provided constitutes any form of investment advice.
Tio Markets UK Limited is a company registered in England and Wales under company number 06592025 and is authorised and regulated by the Financial Conduct Authority FRN: 488900
Risk warning: CFDs are complex instruments and come with a high risk of losing money rapidly due to leverage. 82% of retail investor accounts lose money when trading CFDs with this provider. You should consider whether you understand how CFDs work and whether you can afford to take the high risk of losing your money. Professional clients can lose more than they deposit. All trading involves risk.
DISCLAIMER: Tio Markets offers an exclusively execution-only service. The views expressed are for information purposes only. None of the content provided constitutes any form of investment advice. The comments are made available purely for educational and marketing purposes and do NOT constitute advice or investment recommendation (and should not be considered as such) and do not in any way constitute an invitation to acquire any financial instrument or product. TIOmarkets and its affiliates and consultants are not liable for any damages that may be caused by individual comments or statements by TIOmarkets analysis and assumes no liability with respect to the completeness and correctness of the content presented. The investor is solely responsible for the risk of his/her investment decisions. The analyses and comments presented do not include any consideration of your personal investment objectives, financial circumstances, or needs. The content has not been prepared in accordance with any legal requirements for financial analysis and must, therefore, be viewed by the reader as marketing information. TIOmarkets prohibits duplication or publication without explicit approval.

Janne Muta holds an M.Sc in finance and has over 20 years experience in analysing and trading the financial markets.
