Risk disclaimer: 76% of retail investor accounts lose money when trading CFDs and Spreadbets with this provider. You should consider whether you understand how CFDs and Spreadbets work and whether you can afford to take the high risk of losing your money.
FTSE 100 technical analysis | FTSE weak ahead of UK CPI, the Fed and BoE Rate Decisions
BY Janne Muta
|September 19, 2023Today's FTSE 100 technical analysis report focuses on price action and market indicators as traders need to navigate the upcoming CPI release and the Fed rate decision tomorrow and the BoE rate decision the day after. All these events will have an impact on the FTSE 100. In fact, the market has started to react already! The bearish shooting star candle caused a sell off yesterday. Read today's report to see if the bearish price action might continue today!
Resistance Levels and Overbought Conditions
The FTSE 100 is currently grappling with a key resistance level at 7717. This comes as the stochastic oscillator indicates an overbought condition, suggesting that caution is warranted for traders contemplating new positions.
Mixed Economic Signals
Amid the technical indicators, the UK's economy sends mixed signals that add a layer of complexity to market analysis. While the GDP growth for Q2 2023 surpassed market expectations, inflation remains elevated, moderating only slightly to 6.8% in July from 7.9% in the previous month.
Inflation and BoE
While inflation is on a downward trajectory due to the Bank of England's tightening measures, the labour market is showing signs of strain. The coexistence of rising wages and increasing unemployment further complicates this landscape, making it less likely the BoE will hike the rates this week. However, the CPI reading released tomorrow could change this outlook. This is why it is highly important to utilise FTSE 100 technical analysis to gain a better view of the market reactions.
Profit-taking and Upcoming Key Risk Events
Traders might be taking profits today following the index's strong recent rally. This cautious behaviour is likely in anticipation of significant upcoming events that could sway the FTSE 100. These include the highly awaited CPI data release tomorrow and the Bank of England's rate decision the day after. Both events stand as key risk factors that could substantially influence the market's direction in the short term.
The key takeaways from this report are
- The FTSE 100 index experienced a decline of 10% from its February high to its August low, before recovering approximately 7% in the last four weeks. The index currently faces a crucial resistance level at 7717. A critical support level is identified at 7214. Both levels are pivotal for traders in determining market entry and exit points.
- The stochastic oscillator for the FTSE 100 index currently reads 80.12, signifying an overbought market condition. This is particularly noteworthy as the index is trading near a resistance level at 7717. Traders should exercise caution and consider multi-time frame analysis to gauge the market's next moves.
- The moving averages for the FTSE 100 index are oscillating around the mid-range of recent weekly price fluctuations, suggesting a sideways market phase. The index is confined within a range, bounded by support at 7214 and resistance at 7722. This lack of directional bias can be vital for traders focusing on range-bound strategies.
- For the bullish scenario to materialise, the FTSE 100 index would need to sustain a rally above 7747. Conversely, a breach of the 7623 level, which aligns with the 23.6% Fibonacci retracement, could trigger further declines. The next support at 7549 coincides with the 38.2% Fibonacci retracement level, adding weight to its significance.
- In the 4-hour time frame, the moving averages are trending upwards, albeit cautiously. The immediate resistance level to monitor is at 7692. A failure to break above this point keeps the market in a short-term bearish state. The 50-period moving average closely aligns with the market structure level at 7549, forming a confluence that traders should watch.
- In Q2 2023, the UK economy grew by 0.2% quarterly and 0.4% year-on-year. Although inflation has moderated to 6.8%, the Bank of England has increased the policy rate to 5.25% to combat inflationary pressures. These fundamental indicators can exert influence on the FTSE 100 index, and traders should factor them into their technical analysis.
Read the full FTSE 100 technical analysis report below.
FTSE 100 technical analysis
Weekly FTSE 100 technical analysis
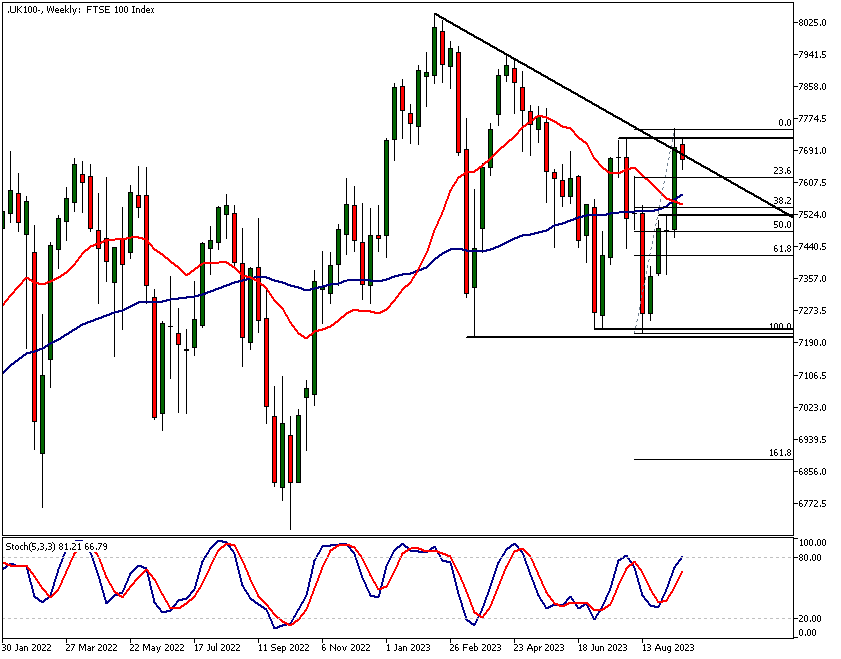
The FTSE 100 index saw a 10% decline from its high in February to its low in August this year. Subsequently, the market recovered by approximately 7% in the last four weeks. This rally initiated from a support level at 7214, a key point identified in earlier FTSE 100 technical analysis. However, momentum appears to be waning after the index reached a resistance level at 7717.
Overbought Conditions
Currently, the stochastic oscillator stands at 80.12, indicating that the market is in an overbought state. This is a critical observation in FTSE 100 technical analysis when the market is at a resistance level. Such conditions necessitate multi-time frame analysis to decipher what price action suggests about the market's likely trajectory.
Moving Averages Indicate Sideways Movement
The moving averages do not show a definitive direction, another point often discussed in FTSE 100 technical analysis. They are positioned around the mid-range of recent weekly fluctuations, suggesting that the market is in a sideways phase. The index is bounded by 7214 at the lower end and 7722 at the upper end.
Indicators of Market Strength and Weakness
Despite creating lower reactionary highs since February, the consistent support around 7214 poses a question: Is the market poised for an upward movement? This query is integral to any nuanced FTSE 100 technical analysis. A decisive break above the 7722 resistance level would make the weekly technical outlook more bullish, potentially targeting the next resistance at 7938.
Daily FTSE 100 technical analysis
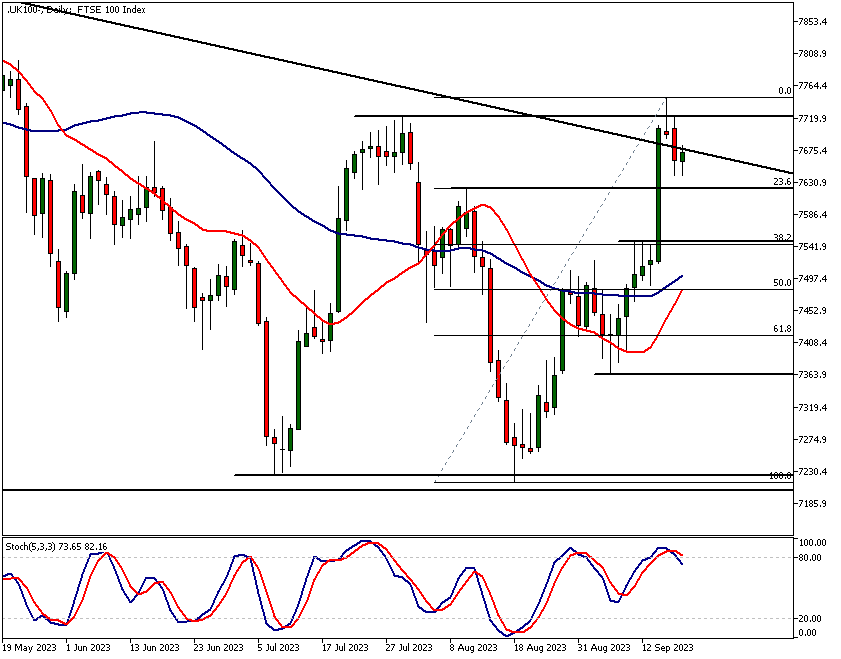
The daily chart shows an attempt to rally above the 7722 resistance level, which failed. A shooting star candle was followed by a bearish wide-range candle. Moreover, the stochastic oscillator rolled over from an overbought position, providing a sell signal that could presage further declines in the FTSE 100 index.
Key Technical Levels on the Daily Time Frame
The immediate technical level to watch is at 7623, aligning closely with the 23.6% Fibonacci retracement level. Penetration of this level might bring the next support at 7549 into play. Interestingly, this coincides with the 38.2% Fibonacci retracement level, a finding commonly discussed in FTSE 100 technical analysis. For a bullish
FTSE 100 technical analysis, 4h chart
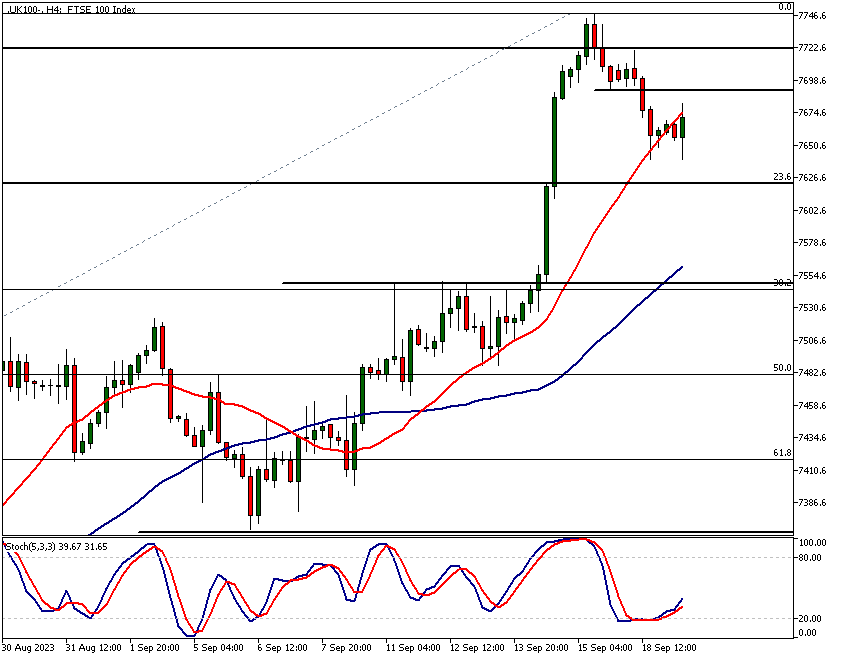
In the 4-hour time frame, the moving averages are trending upward. The fast moving average is above the slow one, reflecting the recent market rally. However, given the daily chart's bearish signals, these bullish indications should be approached with caution.
Confluence of Technical Indicators
The immediate resistance level to watch is at 7692. Remaining below this point keeps the market in a short-term bearish state. Notably, the 50-period moving average aligns closely with the market structure level at 7549 and the 38.2% Fibonacci retracement. Thus FTSE 100 technical analysis shows the market forming a technical confluence that many market participants are likely to follow.
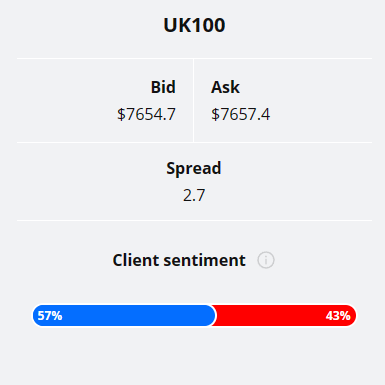
The Client Sentiment indicator doesn't provide strong indication on FTSE 100 index as clients are positioned somewhat evenly in this market: 57% are long while 43% of them are short the market.
Please remember that the retail trader client sentiment is a contrarian indicator as most of the retail traders are on average betting against the market trends. This is why, experienced traders tend to trade against the retail client sentiment. You can follow the TIOmarkets client sentiment live on our Forex dashboard.
FTSE 100 Fundamental Analysis
The UK economy in the second quarter of 2023 exhibits a multifaceted picture. While some sectors are showing resilience and growth, others indicate strains, particularly in the labour market. Below, we delve into various aspects that contribute to this complex economic scenario.
Economic Growth in Q2 2023
The UK outperformed market expectations in the second quarter of 2023, registering a 0.2% growth on a quarterly basis and a 0.4% year-on-year increase. This modest yet noteworthy growth was largely driven by a 0.1% uptick in the services sector and a 0.7% rise in the production sector, led by a robust 1.6% growth in manufacturing.
Consumption and Government Spending
On the expenditure front, household consumption experienced a 0.7% growth, propelled by spending in transport, recreation, and culture, among other sectors. Additionally, government consumption surged by a notable 3.1%, indicating a robust public sector activity. Utilize our FTSE 100 technical analysis views when estimating the market impact of the government consumption trends.
Inflation Trends and Monetary Policy
Inflation showed signs of moderation, with consumer price inflation falling to 6.8% in July 2023, down from 7.9% in the preceding month. This decline was primarily attributed to a significant drop in fuel prices. The core inflation rate, which excludes volatile items like food and energy, remained high at 6.9%, well above the Bank of England's target of 2%.
Labour Market: Declining Employment
The labour market has not fared as well. The unemployment rate has risen to 4.3% for the period between May and July 2023, reaching its highest level since the third quarter of 2021. Employment levels have declined correspondingly, with a significant drop of 207,000, predominantly among full-time self-employed workers.
Wage Dynamics Amid Labour Strains
Despite the uptick in unemployment, wages have seen a contrary movement. Wages, when excluding bonuses, surged by an unprecedented 7.8% year-on-year during the same period, marking the highest increase since records started in 2001. To gain better understanding the market impact of these dynamics read the FTSE 100 technical analysis report above.
Claimnant Account Change
A nuanced aspect of the labour market is the Claimant Count Change, which decreased to 0.90 thousand in August 2023 from 7.40 thousand in July. This suggests a slight, albeit not substantial, improvement in job market conditions.
Labour Productivity: A Silver Lining
Labour productivity showed some resilience, growing by 0.7% in the three months leading up to June 2023. This follows a 1.4% decline in the previous quarter, indicating some underlying strength in the economic fabric.
Concluding Remarks
In summary, while inflation is on a downward trajectory due to the Bank of England's tightening measures, the labour market is showing signs of strain. The coexistence of rising wages and increasing unemployment further complicates this landscape, making it less likely the BoE will hike the rates this week. However, the CPI reading released tomorrow could change this outlook.
Read more analysis on UK economy
Read more analysis on UK economy

The next main risk events
- CAD - Consumer Price Index (CPI)
- CAD - Median CPI
- CAD - Trimmed CPI
- CAD - Common CPI
- USD - Building Permits
- CNY - 1-Year Loan Prime Rate
- CNY - 5-Year Loan Prime Rate
- GBP - Consumer Price Index (CPI)
- USD - Federal Funds Rate
- USD - FOMC Economic Projections
- USD - FOMC Statement
- USD - FOMC Press Conference
For more information and details see the TIOmarkets economic calendar.
While research has been undertaken to compile the above content, it remains an informational and educational piece only. None of the content provided constitutes any form of investment advice.
Tio Markets UK Limited is a company registered in England and Wales under company number 06592025 and is authorised and regulated by the Financial Conduct Authority FRN: 488900
Risk warning: CFDs are complex instruments and come with a high risk of losing money rapidly due to leverage. 82% of retail investor accounts lose money when trading CFDs with this provider. You should consider whether you understand how CFDs work and whether you can afford to take the high risk of losing your money. Professional clients can lose more than they deposit. All trading involves risk.
DISCLAIMER: Tio Markets offers an exclusively execution-only service. The views expressed are for information purposes only. None of the content provided constitutes any form of investment advice. The comments are made available purely for educational and marketing purposes and do NOT constitute advice or investment recommendation (and should not be considered as such) and do not in any way constitute an invitation to acquire any financial instrument or product. TIOmarkets and its affiliates and consultants are not liable for any damages that may be caused by individual comments or statements by TIOmarkets analysis and assumes no liability with respect to the completeness and correctness of the content presented. The investor is solely responsible for the risk of his/her investment decisions. The analyses and comments presented do not include any consideration of your personal investment objectives, financial circumstances, or needs. The content has not been prepared in accordance with any legal requirements for financial analysis and must, therefore, be viewed by the reader as marketing information. TIOmarkets prohibits duplication or publication without explicit approval.

Janne Muta holds an M.Sc in finance and has over 20 years experience in analysing and trading the financial markets.
