Risk disclaimer: 76% of retail investor accounts lose money when trading CFDs and Spreadbets with this provider. You should consider whether you understand how CFDs and Spreadbets work and whether you can afford to take the high risk of losing your money.
DAX technical analysis | Israel - Hamas war, market sentiment analysis
BY Janne Muta
|October 9, 2023Markets globally have reacted to a severe assault by Hamas on Israel that led to hundreds of civilian and military casualties. Israel retaliated and declared war on Hamas, creating concerns that the conflict could be a long one and perhaps widen into a war that spreads to neighbouring countries.
Financial Market's Modest Response
The reaction in financial markets has been surprisingly modest, with the S&P 500 gapping lower by less than 0.8% while the DAX gapped down by only 0.6%. The price of USOIL gapped higher by 2.44% and rallied further before giving back the earlier gains.
Potential Implications on Oil Prices and Inflation
If the fighting spreads to other Middle Eastern countries, the price of oil could continue to rise, which would increase inflation expectations and therefore add to speculation of interest rates remaining higher for longer than expected.
Downward Pressure on DAX and Other Equity Indices
In this scenario, we might see further downward pressure on DAX and other equity indices. In this report, we provide our readers with DAX technical analysis as we seek to understand the technical picture in this market and how it might develop under different scenarios.
The next key risk events for DAX are
- ECB President Lagarde Speaks
- US PPI and Core PPI
- US CPI and Core CPI
Read the full DAX technical analysis report below
DAX technical analysis

Weekly DAX technical analysis
The DAX created a widening top formation between May and July this year. Since then, the market ranged sideways for a while before breaking below a key support level at 15,454. Our DAX technical analysis indicates a weakening sentiment since the summer, mirrored by the contraction in moving averages. The 50-period moving average is still pointing higher, but the 20-period moving average is pointing lower.
Emergence of Bearish Indicators
This contraction in the moving averages follows from the weakness we've seen in the DAX index since the summer. The stochastic oscillator is currently at 24.65, indicating that the market is near to levels where it is considered oversold, and indeed, there has been a 9.55% decline from the July high to last week's low.
Descending Trendline Support Analysis
It's interesting how the market is now trading near the descending trendline support, which is an extension line of the trend line that connected the lows in the widening top formation. Two weeks ago, the weekly low was exactly at this descending trend line support; however, since then, the market has penetrated this low, suggesting that it remains weak.
Geopolitical Impacts and Market Reaction
Another sign of weakness in the DAX was the inability to rally above the key resistance level at 15,454, and now, after Hamas' massive attack on Israel, the market has gapped lower, suggesting we might see even further weakness in this market.
Market Weakness Continuation Scenario
Our DAX technical analysis suggests that the market may continue to exhibit weakness, especially if geopolitical tensions escalate further. If the weakness continues, look for a move to last week's low at 14,944.
Extended Geopolitical Crisis Impact
If the crisis in Israel turns into a prolonged war between Hamas and Israel spreading beyond Israel's borders, there could be further weakness, even beyond last week's low. This option seems unlikely at the time of writing this, but if this were to be the case, then we might see the market moving down to the 38.2% Fibonacci retracement level at 14,734.
Daily DAX technical analysis
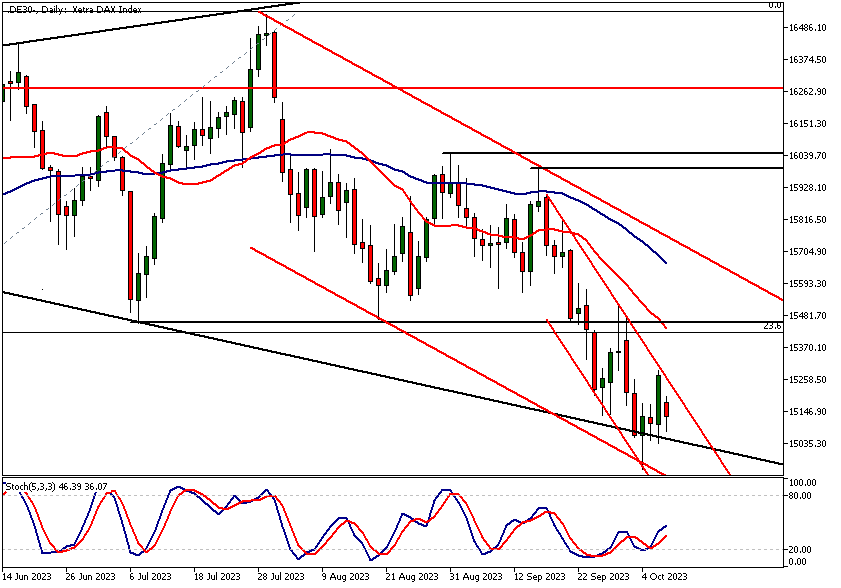
The daily chart reveals how the DAX has been trending lower in a descending price channel that's within a wider descending price channel. Last week, the market traded down to the low of the wider price channel.
Oversold Market within the Price Channel
Therefore, in terms of channel analysis, the DAX index is oversold; however, the market is trending lower, therefore it can stay oversold for longer periods of time. In order for the DAX to turn bullish, it needs to break out from the price channel and maintain levels above 15,291.
Resistance Zone and Potential Bullish Reversal
This would open the way to the nearest technical confluence area between 15,425 and 15,513. This resistance zone is created by the key resistance level we mentioned in the weekly DAX technical analysis section above (15,454), the 23.6% Fibonacci retracement level, and the 20-period moving average.
Daily and 4-Hour Chart Analysis
Both moving averages, the 20 and 50-period SMA, are currently pointing lower, while the stochastic oscillator on the daily chart is pointing higher. DAX technical analysis therefore suggests that the market is trending lower, but there is some loss of downside momentum which could embolden the bulls to move the market higher.
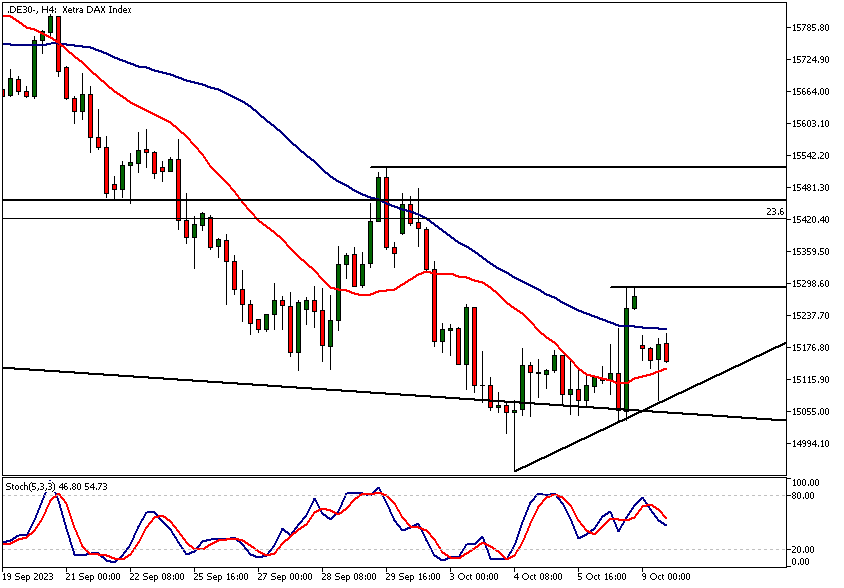
DAX technical analysis, 4h
The indications on the 4-hour chart are fairly similar to the daily chart. The market is trending lower with the 20 and 50-period moving averages in the bearish order; the 20-period SMA is below the 50-period SMA.
The moving average convergence shows some loss of downside momentum after the market has created two higher lows at 15,034 and 15,046. In order to reverse the downtrend, our DAX technical analysis indicates, the market needs to create a decisive rally above 15,291.
Projected Market Movement
In the case of such a rally taking place, we might see the market eventually rallying to 15,734. This projection is based on the width of the descending trend channel the market currently trades in.
The market has created two higher lows at 15,037 and 15,075 which suggest indicate there is an attempt to move the market higher. However we need to see continued buying above 15.075 to validate this indication.
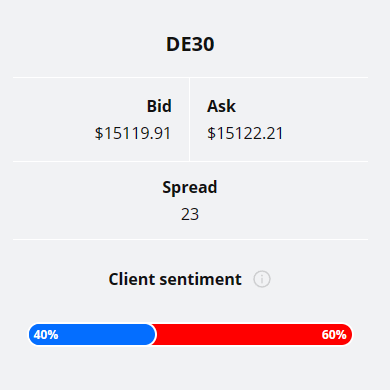
TIOmarkets' clients are currently modestly bullish on DAX with 60% of the clients holding long positions and 40% holding short positions. Therefore, there client sentiment analysis doesn't provide strong indication in either direction.
Please remember that the retail trader client sentiment is a contrarian indicator as most of the retail traders are on average betting against the market trends. This is why, experienced traders tend to trade against the retail client sentiment. You can follow the TIOmarkets client sentiment live on our Forex dashboard.
The Impact of Hamas Terror Attack, Sentiment Analysis
Over the weekend, a significant assault was launched on Israel by Hamas, marking it the largest in several years and the deadliest day of violence witnessed in the country in 50 years. The attack saw Hamas gunmen infiltrate multiple Israeli towns.
Israel's Retaliatory Measures
Israel responded with airstrikes, resulting in upwards of 370 fatalities in Gaza. Concurrently, Hamas fighters claimed 600 lives and abducted numerous individuals in various Israeli towns. According to the latest updates at least 700 are reported killed in Israel and more than 400 in Gaza.
Declaration of War and Regional Implications
With the official declaration of war by the Israeli government, it's clear that this could be a long conflict creating instability for several months to come. And, there lies a significant risk of further escalation. Various media outlets have been exploring the potential for this Israeli-Palestinian conflict to spill over beyond Israeli borders, hinting at a potential regional escalation.
Market Reaction to Middle East Violence
In the financial markets, the violence triggered a shift towards safe-haven assets as investors grew concerned over the unfolding violence in the Middle East. This uncertainty deepened existing market strains caused by elevated interest rates. Moreover, the unrest prompted a spike in oil prices, with USOIL nearing $86 a barrel, driven by fears of a war-risk premium re-emerging in the markets.
Historical Trends and Future Market Implications
According to Yardeni Research, Middle Eastern geopolitical crises have typically triggered a rise in oil prices and a decline in stock prices. However, more often than not, these events have also emerged as buying opportunities in the stock market. The extent of the crisis's impact hinges on whether it remains a short-term flare-up or evolves into a larger conflict; for instance, a war between Israel and Iran.
We hope that our DAX technical analysis report helps you to make better trading decisions as you seek to understand how the various risk factors (potentially higher oil price and inflation due to geopolitical challenges) impact the markets.
The key takeaways from this report
- The DAX's 50-period moving average, still pointing upwards, hints at lingering bullish sentiments, yet the contrasting downward 20-period moving average reflects the market's recent bearish tendencies, illustrating a tug-of-war between bullish and bearish market sentiments.
- Stochastic oscillator reading of 24.65 on the DAX implies nearing oversold territory. Following a 9.55% decline from July’s high to last week’s low, it's a warning sign of persistent bearish momentum since the summertime widening top formation.
- The DAX index, trading near the descending trendline support, reflects ongoing market weakness. Two weeks ago, the weekly low met this support; however, a subsequent breach suggests the market remains in a bearish grip.
- After the geopolitical event of Hamas' attack on Israel, the DAX dropped from a key resistance level at 15 289, suggesting bearish mood in the market. This level acts as a critical juncture for market direction amidst geopolitical tensions.
- In a scenario of an extended geopolitical crisis, the DAX might plummet beyond last week's low towards the 38.2% Fibonacci retracement level at 14,734, portraying the bearish control on the market amidst geopolitical uncertainties.
- Currently trading within a descending price channel, the DAX needs a decisive rally above 15,291 to change its bearish narrative. Such a rally could potentially lead towards 15,734, offering a semblance of hope for bullish traders amidst a bearish backdrop.
Read more analysis on DAX

The next main risk events
- AUD - NAB Business Confidence
- CNY - New Loans
- EUR - ECB President Lagarde Speaks
- USD - FOMC Member Waller Speaks
- USD - Core PPI m/m
- USD - PPI m/m
- USD - FOMC Member Waller Speaks
- USD - FOMC Meeting Minutes
- GBP - GDP m/m
- USD - Core CPI m/m
- USD - CPI m/m
- USD - CPI y/y
- USD - Unemployment Claims
- CNY - CPI y/y
- CNY - PPI y/y
- GBP - BOE Gov Bailey Speaks
- EUR - ECB President Lagarde Speaks
- USD - FOMC Member Harker Speaks
- USD - Prelim UoM Consumer Sentiment
- USD - Prelim UoM Inflation Expectations
- GBP - BOE Gov Bailey Speaks
- EUR - ECB President Lagarde Speaks
For more information and details see the TIOmarkets economic calendar.
While research has been undertaken to compile the above content, it remains an informational and educational piece only. None of the content provided constitutes any form of investment advice.
Tio Markets UK Limited is a company registered in England and Wales under company number 06592025 and is authorised and regulated by the Financial Conduct Authority FRN: 488900
Risk warning: CFDs are complex instruments and come with a high risk of losing money rapidly due to leverage. 82% of retail investor accounts lose money when trading CFDs with this provider. You should consider whether you understand how CFDs work and whether you can afford to take the high risk of losing your money. Professional clients can lose more than they deposit. All trading involves risk.
DISCLAIMER: Tio Markets offers an exclusively execution-only service. The views expressed are for information purposes only. None of the content provided constitutes any form of investment advice. The comments are made available purely for educational and marketing purposes and do NOT constitute advice or investment recommendation (and should not be considered as such) and do not in any way constitute an invitation to acquire any financial instrument or product. TIOmarkets and its affiliates and consultants are not liable for any damages that may be caused by individual comments or statements by TIOmarkets analysis and assumes no liability with respect to the completeness and correctness of the content presented. The investor is solely responsible for the risk of his/her investment decisions. The analyses and comments presented do not include any consideration of your personal investment objectives, financial circumstances, or needs. The content has not been prepared in accordance with any legal requirements for financial analysis and must, therefore, be viewed by the reader as marketing information. TIOmarkets prohibits duplication or publication without explicit approval.

Janne Muta holds an M.Sc in finance and has over 20 years experience in analysing and trading the financial markets.
