Risk disclaimer: 76% of retail investor accounts lose money when trading CFDs and Spreadbets with this provider. You should consider whether you understand how CFDs and Spreadbets work and whether you can afford to take the high risk of losing your money.
AUD CHF technical analysis | Key Technical Confluence Level Reached
BY Janne Muta
|September 27, 2023This comprehensive AUD CHF technical analysis evaluates key technical and fundamental factors shaping the price action in the AUDCHF currency pair. At the time of the AUDCHF pair trading at a key resistance area just after the Australia CPI release and few hours before the SNB Chairman Jordan's Speech an update on AUD CHF technical analysis is vital.
On the weekly chart, AUDCHF has ascended to a critical resistance at 0.5850, which is aligned with the 23.6% Fibonacci retracement and the 20-period moving average. The stochastic oscillator has surged past 80, indicating an overbought market.
The daily chart shows a loss of momentum, confirmed by a narrow-range candle and a stochastic oscillator above 80. On the 4-hour chart, both SMA(20) and SMA(50) are bullish, although a bearish shooting star candle signals caution.
Fundamentally, the latest Consumer Price Index (CPI) data for Australia indicates an acceleration in inflation to 5.2% year-on-year in August 2023, up from 4.9% in July. This increase is primarily attributed to a surge in transport prices and a modest rise in sectors like communications, education, and financial services.
Our AUD CHF technical analysis report helps you to make sense of the price swings and helps you to prepare for trading the pair ahead of the Chairman Jordan's speech tonight.
The AUD CHF technical analysis report, key takeaways:
- The weekly chart of AUD CHF shows the market rallying to a key resistance level at 0.5850. This price coincides with the 23.6% Fibonacci retracement and the 20-period moving average. The upper end of the bearish channel is at 0.5890, making this a critical technical confluence area.
- The stochastic oscillator on the weekly chart has moved above the 80 level, signifying an overbought condition. A sustained move beyond 0.5890 could target the 38.2% Fibonacci level at 0.5976. Alternatively, a bearish reversal could push prices down to 0.5655.
- The daily chart reveals a narrow-range candle, indicating loss of momentum. The market is trading in a bullish channel but is approaching a key resistance area. The stochastic oscillator above 80 suggests overbought conditions, with a potential downside to between 0.5740 and 0.5760.
- On the 4-hour chart, both SMA(20) and SMA(50) are pointing higher, suggesting bullishness. However, the appearance of a bearish shooting star candle signals potential reversal. If correction occurs, watch for the support level at 0.5821 and channel low at 0.5800.
- Fundamental analysis shows Australia's CPI rising to 5.2% YoY in August 2023. This data raises speculation of the Reserve Bank of Australia tightening monetary policy. However, the AUD has only slightly reacted to the CPI data, making technical levels crucial for traders.
- Intraday levels to watch include the 4h bull channel low at 0.5800 and the next support at 0.5788. On the upside, key resistance is between 0.5880 and 0.5890, formed by the tops of the ascending and descending trend channels. A break here could pave the way for an extended rally.
The next key risk events for AUDCHF are
- CHF - SNB Chairman Jordan's Speech tonight.
- AUD - Retail Sales
Read the full AUD CHF technical analysis report below.
AUD CHF technical analysis
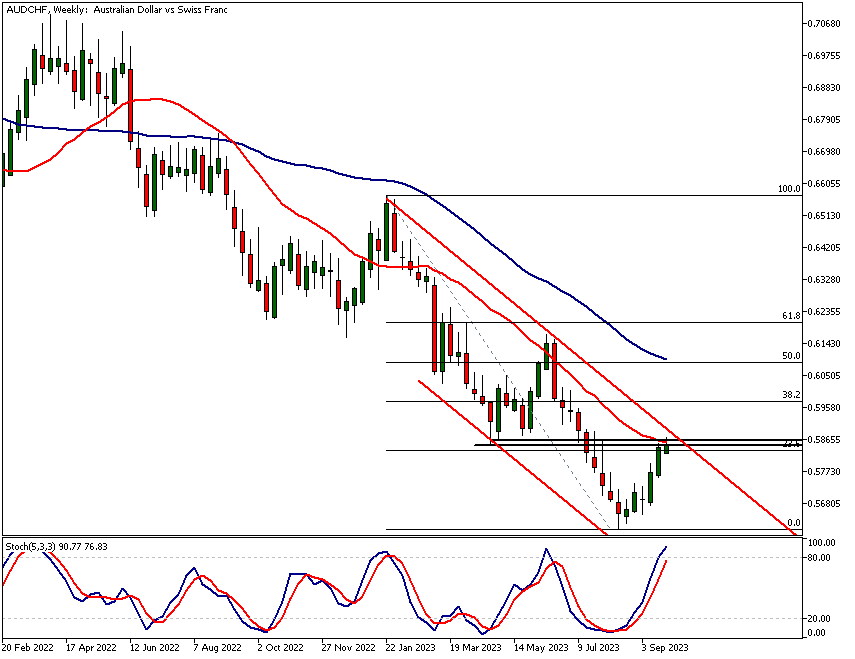
AUD CHF analysis, weekly chart
In the weekly chart, the market has rallied strongly and has reached a key resistance level where several technical factors are aligned together. The market has reached the 0.5850 level, which used to support the market in April of this year. This level is also roughly aligned with the 23.6% Fibonacci retracement level and the 20-period moving average.
Bearish Trend Channel
AUD CHF technical analysis shows the upper end of the bearish trend channel is not far either; the current channel high is at 0.5890. When many technical factors align together, it suggests that the technical confluence area they create is highly important.
Overbought Conditions
At the same time, the stochastic oscillator has moved above the 80 level. This is a level where the indicator is considered to be overbought. If the market can move beyond 0.5890 and sustain levels above it, we might see a move to the 38.2% Fibonacci retracement level at 0.5976.
Bearish Scenarios
Alternatively, if the bears are strong enough to overcome the demand provided by the bulls, and they can push the market lower, we might see the market moving down to 0.5655. This is where the daily and intraday AUD CHF technical analysis can help us understand how likely this potential reversal is.
Current Downtrend Indicators
At the time of writing this, the market is still clearly in a downtrend. It has been creating lower lows and lower highs in the weekly chart, and the moving averages point lower. The fast 20-period moving average is below the slow 50-period moving average; in other words, they are in a bearish order.
Recent Weakness in CHF
However, at the same time, the Swiss franc has been under pressure across the board over the last few weeks. It has lost ground against all the major currencies. Therefore, we shouldn't take it for granted that technical levels identified using AUD CHF technical analysis will be able to turn the market down again. We need to see evidence for this in price action before initiating trades.

AUD CHF analysis, daily chart
The daily chart shows us how the market is trading higher in a bullish trend channel but it is losing momentum inside the key technical confluence level that we discussed in the weekly AUD CHF technical analysis.
Yesterday's price candle was a narrow-range candle with the opening and closing prices at identical levels. A candle like this indicates momentum loss in the market; in other words, the bulls are not in absolute control anymore as selling pressure is coming into the market.
Stochastic Oscillator in Daily Timeframe
The stochastic oscillator is moving above the 80 level. If it crosses below 80, it gives an indication of further erosion in the upside momentum and possibly even a momentum reversal in the daily timeframe.
Next Technical Confluence Area
So how far is the market possibly likely to move if this reversal happens? Our AUD CHF technical analysis identifies the next technical confluence area between 0.5740 and 0.5760.
This is also an area that contains both of the moving averages. Both 50 and 20-period moving averages align with this confluence area.
Furthermore, this area contains the 50% Fibonacci retracement level when the Fib-levels are measured from the August low to the latest high.
Key Focus Area for Market Operators
Therefore, this is a key area that many market operators will focus on. It could thus be viewed as a target area for those taking short trades. Alternatively, if the market continues to rally and is indeed able to move beyond the bearish trend channel high, then we might see a continuation in the rally to around 0.5975 or so.
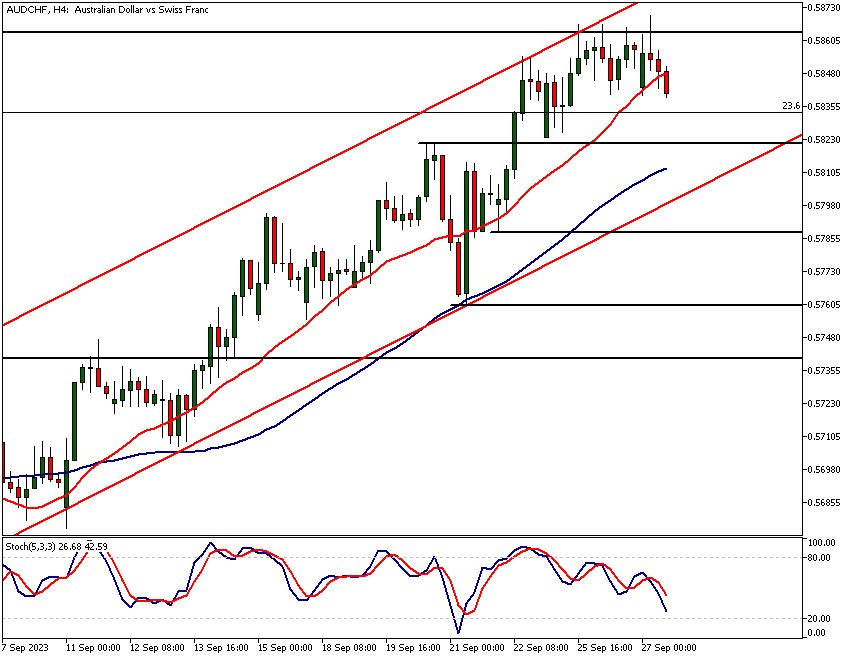
AUD CHF analysis, 4h chart
Both moving averages are currently pointing higher in the 4h chart. With the fast, SMA(20) above the slower SMA(50) the setup is bullish indicating higher prices. Another bullish technical factor is the ascending trend channel the currency pair is trading in.
Loss of Momentum and Bearish Signs
However, as discussed above in the daily AUD CHF technical analysis the loss of momentum could lead to corrective price action. In addition to this, the last complete four-hour candle is a bearish shooting star candle. The indication is that the market tried to rally but failed during this time period.
Potential Support Levels in 4h Chart
If the correction takes place, the 0.5821support level could come into play. In the case this level gives in, look for a move to the 4h bull channel low (currently at 0.5800). The next 4h support level below the channel low is at 0.5788.
Below the channel low the market could trade down to 0.5750. Above the current market price, the nearest key resistance area, our AUD CHF technical analysis shows, is created by the ascending and descending trend channel tops (currently between 0.5880 - 0.5890).

AUD and CHF currency strength analysis
At the time of writing this, CHF is the weakest currency and the AUD is the second weakest just after the CPI report suggested inflation is likely to remain high.
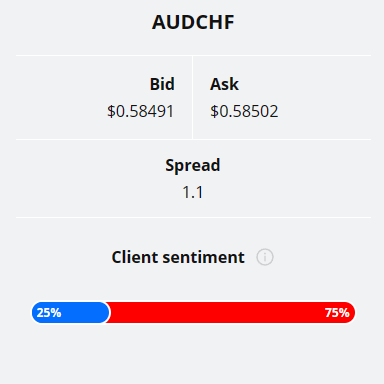
An overwhelming majority of TIOmarkets' clients (75%) are holding short positions in the AUDCHF currency pair. Read the full AUD CHF technical analysis report to see how traders should position themselves in the event of either bullish or bearish market scenarios taking place.
Please remember that the retail trader client sentiment is a contrarian indicator as most of the retail traders are on average betting against the market trends. This is why, experienced traders tend to trade against the retail client sentiment. You can follow the TIOmarkets client sentiment live on our Forex dashboard.
AUD CHF fundamental analysis
The latest Consumer Price Index (CPI) data for Australia indicates an acceleration in inflation to 5.2% year-on-year in August 2023, up from 4.9% in July. This increase is primarily attributed to a surge in transport prices and a modest rise in sectors like communications, education, and financial services.
Inflation Variances Across Sectors
However, some areas like housing and food have seen a slight deceleration in inflation. The trimmed mean measure, another gauge of underlying inflation, remained elevated at 5.6% year-on-year, and the CPI excluding volatile items like fruit, vegetables, automotive fuel, and travel was 5.5%, slightly down from 5.8% in July.
Implications for RBA's Monetary Policy
While this is only one data point the rising inflation levels lead to speculation on the Reserve Bank of Australia's (RBA) tightening its monetary policy. If inflation remains elevated it could erode consumer purchasing power, thereby affecting consumer spending (a vital component of economic growth). Our AUD CHF technical analysis shows the AUD reacting only slightly to the CPI data release.
Sectoral Impact and Household Economics
At the same time, sectors like transport and education becoming more expensive could add to household costs, impacting savings and investment. From the RBA's perspective, the persistent above-target inflation will intensify pressure to further tighten monetary policy, possibly leading to a rise in interest rates in the near future. Use our AUD CHF technical analysis to gain a better understanding of how inflation and Australian economic trends impact the AUDCHF currency pair.
RBA's Recent Stance on Inflation
In its most recent meeting, the RBA board indicated that although inflation has reached its peak, the levels are still excessively high and are expected to remain so for an extended period. The RBA further stressed that additional monetary tightening might be necessary to realign inflation with the bank's target range of 2 to 3%. However, the central bank also noted that any adjustments to the rate would be contingent on the unfolding economic conditions and price trends.
Switzerland Economy Overview
Switzerland's economy shows stagnant GDP growth, a contraction in equipment and software investment, and a decline in construction investment contrast with a resilient employment market.
In the latest meeting the Swiss National Bank (SNB) defied market expectations by maintaining its benchmark rate at 1.75%, citing effective prior monetary tightening. At, the same time, trade dynamics indicate an expanding current account surplus, driven by a goods surplus.
Vulnerabilities and Monetary Stance
Despite strengths in foreign trade and employment, vulnerabilities exist in investment and the services sector, warranting a cautious monetary approach by the SNB.
We hope that this AUD CHF technical analysis helps you to find better trading opportunities as you plan your trades in the currency pair. For more in depth analysis on Switzerland economy read our USDCHF analysis report from yesterday.
The main findings in this report
- AUDCHF is trading at a key technical confluence level at 0.5850, which is aligned with the 23.6% Fibonacci retracement level, the 20-period moving average, and the upper end of the bearish trend channel. If the market can move beyond 0.5890 and sustain levels above it, we might see a move to the 38.2% Fibonacci retracement level at 0.5976.
- The daily chart shows that AUDCHF is trading higher in a bullish trend channel but it is losing momentum inside the key technical confluence level at 0.5850. The next technical confluence area is between 0.5740 and 0.5760, which contains both of the moving averages and the 50% Fibonacci retracement level. This is a key area that many market operators will focus on. It could thus be viewed as a target area for those taking short trades.
- The 4h chart shows that AUDCHF is trading in an ascending trend channel. However, the loss of momentum could lead to corrective price action. In addition to this, the last complete four-hour candle is a bearish shooting star candle. If the correction takes place, the 0.5821 support level could come into play. In the case this level gives in, look for a move to the 4h bull channel low (currently at 0.5800).
- The latest Consumer Price Index (CPI) data for Australia indicates an acceleration in inflation to 5.2% year-on-year in August 2023, up from 4.9% in July. This increase is primarily attributed to a surge in transport prices and a modest rise in sectors like communications, education, and financial services.
- The RBA has indicated that additional monetary tightening might be necessary to realign inflation with the bank's target range of 2 to 3%. However, the central bank also noted that any adjustments to the rate would be contingent on the unfolding economic conditions and price trends.

The next main risk events
- USD Core Durable Goods Orders m/m
- USD Durable Goods Orders m/m
- CHF SNB Chairman Jordan Speaks
- AUD Retail Sales
- EUR German Prelim CPI
- EUR Spanish Flash CPI
- USD Final GDP
- USD Unemployment Claims
- USD Final GDP Price Index
- USD Pending Home Sales m/m
- USD Fed Chair Powell Speaks
- JPY Tokyo Core CPI
- EUR ECB President Lagarde Speaks
- EUR Core CPI Flash Estimate
- EUR CPI Flash Estimate
- CAD GDP
- USD Core PCE Price Index
- USD Chicago PMI
- USD Revised UoM Consumer Sentiment
- USD FOMC Member Williams Speaks
- CNY Manufacturing PMI
- CNY Non-Manufacturing PMI
For more information and details see the TIOmarkets economic calendar.
While research has been undertaken to compile the above content, it remains an informational and educational piece only. None of the content provided constitutes any form of investment advice.
Tio Markets UK Limited is a company registered in England and Wales under company number 06592025 and is authorised and regulated by the Financial Conduct Authority FRN: 488900
Risk warning: CFDs are complex instruments and come with a high risk of losing money rapidly due to leverage. 82% of retail investor accounts lose money when trading CFDs with this provider. You should consider whether you understand how CFDs work and whether you can afford to take the high risk of losing your money. Professional clients can lose more than they deposit. All trading involves risk.
DISCLAIMER: Tio Markets offers an exclusively execution-only service. The views expressed are for information purposes only. None of the content provided constitutes any form of investment advice. The comments are made available purely for educational and marketing purposes and do NOT constitute advice or investment recommendation (and should not be considered as such) and do not in any way constitute an invitation to acquire any financial instrument or product. TIOmarkets and its affiliates and consultants are not liable for any damages that may be caused by individual comments or statements by TIOmarkets analysis and assumes no liability with respect to the completeness and correctness of the content presented. The investor is solely responsible for the risk of his/her investment decisions. The analyses and comments presented do not include any consideration of your personal investment objectives, financial circumstances, or needs. The content has not been prepared in accordance with any legal requirements for financial analysis and must, therefore, be viewed by the reader as marketing information. TIOmarkets prohibits duplication or publication without explicit approval.

Janne Muta holds an M.Sc in finance and has over 20 years experience in analysing and trading the financial markets.
