Risk disclaimer: 76% of retail investor accounts lose money when trading CFDs and Spreadbets with this provider. You should consider whether you understand how CFDs and Spreadbets work and whether you can afford to take the high risk of losing your money.
USDCHF analysis | USDCHF approaching key weekly resistance area
BY Janne Muta
|September 25, 2023This USDCHF analysis report provides an exhaustive analysis of the USDCHF currency pair. We analyse the weekly, daily and 4h timeframes and provide you with both technical and fundamental perspectives.
Our weekly USDCHF analysis points to a critical resistance at 0.9147, which coincides with the 50-period SMA and the 38.2% Fibonacci level. The daily and 4-hour charts further elaborate on key support and resistance zones, while indicators like the Stochastic Oscillator signal market conditions.
On the fundamental side, the U.S. economy shows relative strength compared to Switzerland, with higher GDP growth and interest rates. Both nations present economic vulnerabilities, but the U.S. dollar appears to be benefiting from a combination of positive economic factors.
The USDCHF analysis report, key takeaways:
- In the USDCHF weekly chart, the market is approaching a pivotal resistance level at 0.9147, aligning closely with the 50-period SMA and the 38.2% Fibonacci retracement level. A decisive bearish turn here could trigger a retracement to around 0.8950. Conversely, a breakout would focus on the 0.9340 to 0.9440 zone.
- On the USDCHF daily chart, a bullish Hammer candle formed last Wednesday at the 0.8944 level, aligning with the 23.6% Fibonacci retracement level. Both fast and slow moving averages are trending higher, making 0.8932 a key support level. Strong upward momentum is indicated by the fast moving average being substantially above the slow 50-period moving average.
- The 4-hour USDCHF chart shows the market trading at the upper end of its bullish channel. Immediate support lies at 0.9078, which could act as a push for higher prices if tested. If this level fails, the 0.9020 to 0.9038 range becomes the next probable support area.
- Fundamental analysis reveals the USDCHF 11-week rally is backed by the U.S. economy's relative strength, with a 2.1% annualised GDP growth for Q2 2023. Inflation rates in the U.S. have exceeded expectations, making tighter monetary policy likely and the USD more attractive compared to the Swiss Franc.
- The Swiss economy shows mixed signals, with stagnant GDP growth and a rise in unemployment to 2% in August 2023. Despite this, non-farm payrolls rose by 2.2% YoY. The Swiss National Bank maintained its benchmark policy rate at 1.75%, leaving room for future rate hikes.
- The U.S. economy, as of September 2023, is grappling with moderate GDP growth of 2.1% and inflationary pressures. Unemployment rose to 3.8%, while the Federal Reserve maintained interest rates at 5.25%-5.5%. Futures traders price only a 35% probability of a rate hike in 2023.
The next key risk events for USDCHF are
- USD - CB Consumer Confidence
- USD - Final GDP
- USD - Core PCE
- CHF - Consumer Price Index
USDCHF analysis

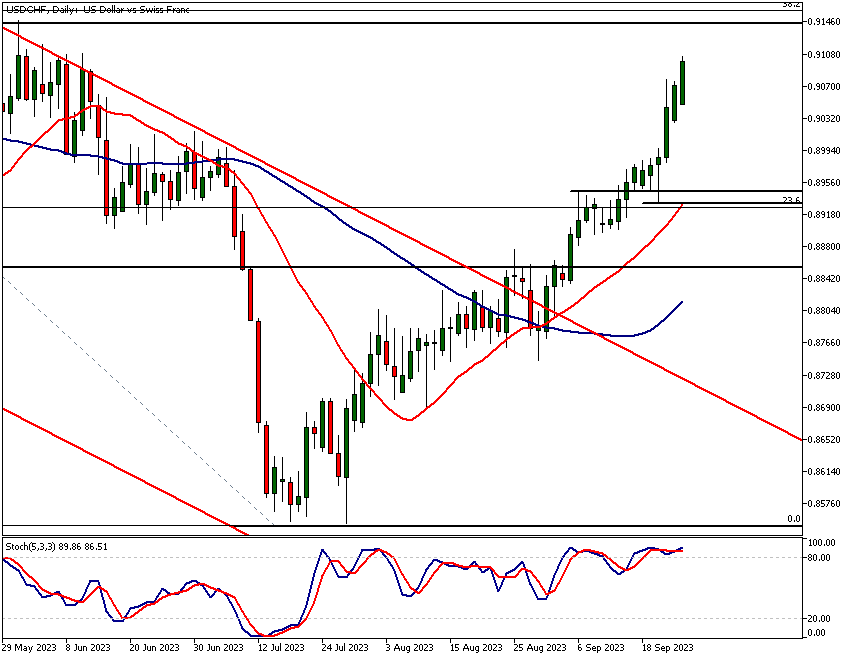
USDCHF analysis, weekly chart
The market has rallied for three consecutive weeks after breaking above the bearish trend channel top. The upward move, commencing from the low point in July, has registered a 6.53% increase and a 2.8% move from the channel top.
Stochastic Oscillator Indicates Overbought Condition
The significant upward movement of the market has pushed the Stochastic Oscillator to an overbought reading of 98.37. However, it's important to note that oscillators can remain in the overbought zone for extended periods.
Key Technical Levels on the Weekly Chart
On the weekly timeframe, our USDCHF analysis shows, the market is approaching a critical resistance level at 0.9147, which coincides with the 50-period SMA and the 38.2% Fibonacci retracement level.
Confluence Zone Identified
The aggregation of these essential technical indicators around the 0.9147 level establishes it as a key technical confluence zone. While it's too early to predict the market's sustained momentum beyond this zone, it is advisable to mark this area on the chart.
Scenarios for Price Action
In the event of profit-taking, especially followed by a decisive bearish reversal, a price retracement to around 0.8950 may occur. Conversely, if the market maintains its upward trajectory, USDCHF analysis suggests, the next significant weekly resistance zone to consider ranges from 0.9340 to 0.9440.
USDCHF analysis, daily chart
In the daily chart, we can see how the rally has become extended since the formation of a bullish Hammer candle last Wednesday. This occurred when the market retested the 0.8944 level following a bullish breakout. Notably, this level aligns with the 23.6% Fibonacci retracement level as drawn in the daily USDCHF analysis chart.
Moving averages point higher
Both the fast and slow moving averages are pointing higher, with the 20-period moving average in close proximity to last Wednesday's low (0.8932). This makes the level a significant support. Also, the above USDCHF analysis chart shows fast moving average is substantially above the slow 50-period moving average, attesting to the strong momentum currently exhibited by the market.
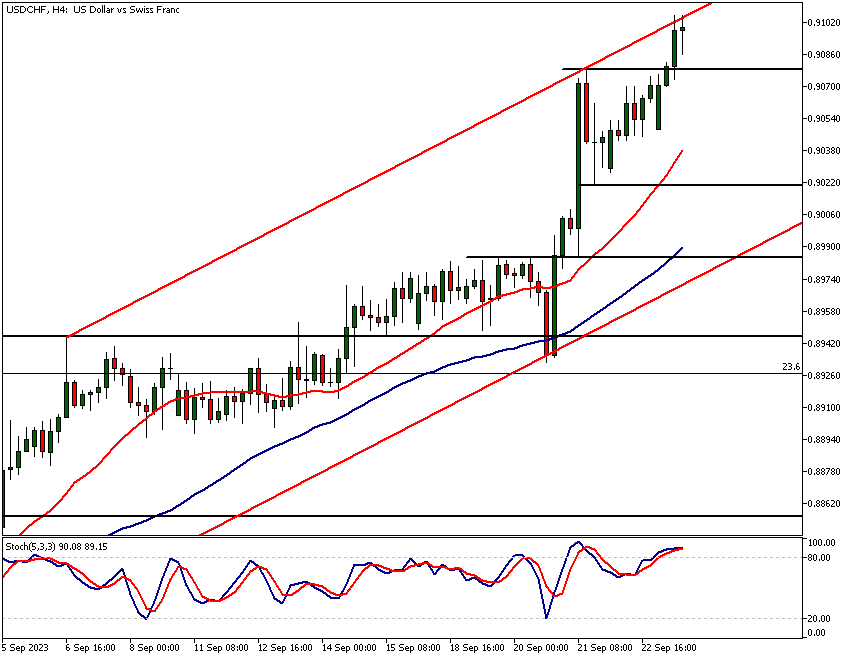
USDCHF analysis, 4h chart
The 4-hour chart reveals that the market is trading at the upper end of its current bullish price channel. The closest support level is at 0.9078, a level that functioned as resistance just last week. Theoretically, this level could act as a support and push the price higher should it get tested.
Potential test of a key 4h support
Should this level fail to hold, the range between 0.9020 and 0.9038 could come into play as the next potential support area. Alternatively, if the market continues its upward trajectory, look for a move towards the confluence area outlined in the weekly chart (see the weekly USDCHF analysis section).
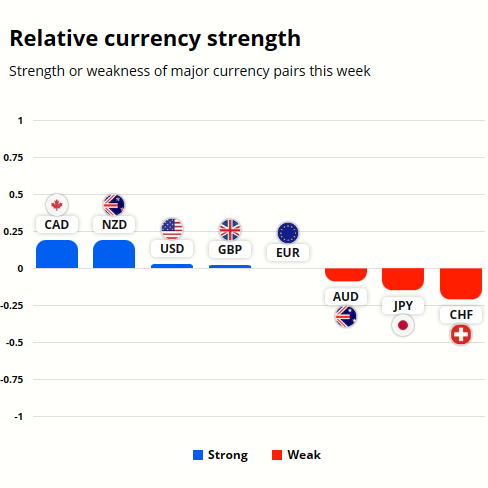
USD and CHF currency strength analysis
Even though the moves this week haven't yet been sizeable it's clear that the greenback (USD) is still much stronger relative to the CHF. USD is the third strongest currency while the CHF is the weakest.
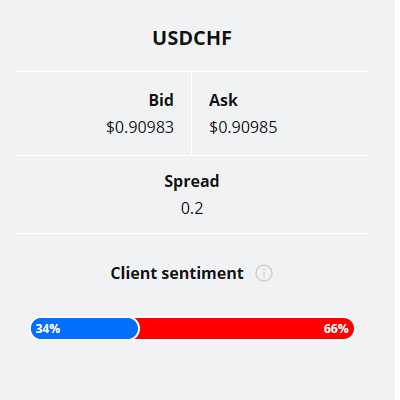
USDCHF is favoured only by 34% of the TIOmarkets' clients. Two thirds (66%) are holding short positions in the market.
Please remember that the retail trader client sentiment is a contrarian indicator as most of the retail traders are on average betting against the market trends. This is why, experienced traders tend to trade against the retail client sentiment. You can follow the TIOmarkets client sentiment live on our Forex dashboard.
Fundamental USDCHF analysis
The 11-week rally in the USDCHF currency pair can be attributed to a combination of factors that have turned the market sentiment towards positive for the USD. The U.S. economy has demonstrated relative strength with a 2.1% annualised GDP growth for Q2 2023, compared to Switzerland's recent GDP growth stagnation.
Inflation rates in the U.S. have also exceeded market expectations, indicating a potential for tighter monetary policy, which typically strengthens a currency. Additionally, the Fed maintained interest rates at the 5.25% - 5.5% range, making the USD more attractive to investors compared to Switzerland's 1.75%.
Employment trends have also favoured the U.S., (high labour force participation rate), while Switzerland saw a concerning rise in unemployment despite some employment gains. At the same time, both countries showed vulnerabilities in trade balances, but the U.S. economy's relative size and growth may be perceived as more robust, contributing to a stronger USD.
Switzerland Economy Overview
The Swiss economy presents a mixed picture as of September 2023. On one hand, GDP growth remained stagnant in the second quarter, with a 0.3% increase from the previous quarter. A sharp contraction in equipment and software investment of 3.7% and a decline in construction investment of 0.8% highlight the impact of Switzerland's monetary tightening on multiple sectors.
Employment Resilience and Sectoral Disparities
The analysis begins by scrutinizing the employment landscape, noting a resilient non-farm payroll growth of 2.2% year-on-year. However, this resilience is juxtaposed with a rise in overall unemployment to 2% in August, highlighting disparities in job growth across sectors and demographics. Youth unemployment, specifically at 2.2%, underscores the uneven distribution of employment opportunities.
Assessment of Monetary Policy
Shifting focus to monetary policy, the Swiss National Bank (SNB) maintained its benchmark policy rate at 1.75%, diverging from market expectations that anticipated a 25 basis point increase. The SNB justified this decision by affirming the effectiveness of prior monetary tightening measures in addressing inflation.
However, it maintained an openness to potential future rate hikes while keeping inflation forecasts steady at 2.2% for 2023 and 2024. Our USDCHF analysis, we trust, will aid you in identifying good entry and exit points in this market.
Analysis of Trade and Current Account
The analysis delves into foreign trade dynamics, noting the expansion of the current account surplus to CHF 20 billion during the second quarter. This expansion primarily resulted from a marked increase in the goods surplus. Concurrently, deficits in the services, primary, and secondary income accounts widened, signifying pockets of economic vulnerability within the Swiss economy.
Exploration of Trade Surplus
Further observations relate to the trade surplus, which exhibited growth in August. Exports notably surged by 6.6% month-on-month, driven by strong showings in chemical and pharmaceuticals, machinery and electronics, watches, and precision instruments.
Overall Economic Landscape
The comprehensive assessment culminates in an overview of Switzerland's economic landscape. Despite a robust external position and a resilient employment market, it unveils internal vulnerabilities, particularly in the realms of investment and the services sector.
SNB's Cautious Monetary Approach
The SNB's decision to pause its rate-hiking campaign while maintaining vigilance over inflation signifies a cautious stance towards monetary policy. Given this intricate economic backdrop, it suggests the potential necessity of targeted policies to address specific vulnerabilities while leveraging the nation's strengths.
For a nuanced understanding of economic impact and market dynamics we believe our USDCHF technical analysis is indispensable.
United States Economy Overview
As of September 2023, the U.S. economy exhibits a blend of growth, inflationary pressures, and labour market complexities. The second quarter saw a modest annualised GDP growth rate of 2.1%, slightly lower than initially forecasted.
Factors Impacting Moderate Growth
Factors contributing to this moderate growth include a deceleration in consumer spending, a decline in government consumption, and significant drops in exports and residential fixed investment.
Mixed Inflationary Trends
Inflation presents a mixed picture. Core consumer prices in August rose by 0.3%, surpassing market expectations and marking an acceleration from previous months. This upturn was particularly pronounced in transportation and shelter sectors.
Labour Market Dynamics
Simultaneously, the overall consumer price index advanced 0.6% month-over-month, fuelled chiefly by a sharp rise in gasoline prices. On an annual basis, inflation accelerated to 3.7%, exceeding market projections, while core inflation decelerated to 4.3%, aligned with market expectations. Producer prices also surged by 0.7%, mainly due to increased energy costs, surpassing market anticipations.
To better understand the impact of labour market dynamics in the market itself please refer to the technical part of our USDCHF analysis above.
The labour market offers some encouragement but also raises concerns. The labour force participation rate hit its highest level since February 2020, and the ISM Services PMI indicates strong growth in the services sector.
However, job gains have fallen below the 200,000 threshold for three consecutive months. The unemployment rate has risen to 3.8%, the highest in over a year, while average hourly earnings have grown at a slower pace, raising questions about future consumer spending.
Federal Reserve's Monetary Policy
The Federal Reserve maintained its federal funds rate at a 22-year high of 5.25%-5.5% in its September meeting, although signalling a potential hike later this year. Economic projections were generally revised upwards for 2023 and 2024.
Interestingly, futures traders are not fully convinced by the Fed's signalling; they are pricing only a 35% probability of a 25 basis point rate hike in 2023 and expect the first rate cut by July next year.
Summary
In summary, the U.S. economy is at an inflection point, grappling with the dual challenges of slowing growth and persistent inflationary pressures. The Federal Reserve faces a complicated task of balancing the risks associated with both inflation and economic stagnation, making the policy pathway ahead increasingly intricate.

The next main risk events
- EUR ECB President Lagarde Speaks
- USD S&P/CS Composite-20 HPI
- USD CB Consumer Confidence
- USD New Home Sales
- USD Richmond Manufacturing Index
- AUD CPI
- USD Core Durable Goods Orders m/m
- USD Durable Goods Orders m/m
- CHF SNB Chairman Jordan Speaks
- AUD Retail Sales
- EUR German Prelim CPI
- EUR Spanish Flash CPI
- USD Final GDP
- USD Unemployment Claims
- USD Final GDP Price Index
- USD Pending Home Sales m/m
- USD Fed Chair Powell Speaks
- JPY Tokyo Core CPI
- EUR ECB President Lagarde Speaks
- EUR Core CPI Flash Estimate
- EUR CPI Flash Estimate
- CAD GDP
- USD Core PCE Price Index
- USD Chicago PMI
- USD Revised UoM Consumer Sentiment
- USD FOMC Member Williams Speaks
- CNY Manufacturing PMI
- CNY Non-Manufacturing PMI
For more information and details see the TIOmarkets economic calendar.
While research has been undertaken to compile the above content, it remains an informational and educational piece only. None of the content provided constitutes any form of investment advice.
Tio Markets UK Limited is a company registered in England and Wales under company number 06592025 and is authorised and regulated by the Financial Conduct Authority FRN: 488900
Risk warning: CFDs are complex instruments and come with a high risk of losing money rapidly due to leverage. 82% of retail investor accounts lose money when trading CFDs with this provider. You should consider whether you understand how CFDs work and whether you can afford to take the high risk of losing your money. Professional clients can lose more than they deposit. All trading involves risk.
DISCLAIMER: Tio Markets offers an exclusively execution-only service. The views expressed are for information purposes only. None of the content provided constitutes any form of investment advice. The comments are made available purely for educational and marketing purposes and do NOT constitute advice or investment recommendation (and should not be considered as such) and do not in any way constitute an invitation to acquire any financial instrument or product. TIOmarkets and its affiliates and consultants are not liable for any damages that may be caused by individual comments or statements by TIOmarkets analysis and assumes no liability with respect to the completeness and correctness of the content presented. The investor is solely responsible for the risk of his/her investment decisions. The analyses and comments presented do not include any consideration of your personal investment objectives, financial circumstances, or needs. The content has not been prepared in accordance with any legal requirements for financial analysis and must, therefore, be viewed by the reader as marketing information. TIOmarkets prohibits duplication or publication without explicit approval.

Janne Muta holds an M.Sc in finance and has over 20 years experience in analysing and trading the financial markets.
