Risk disclaimer: 76% of retail investor accounts lose money when trading CFDs and Spreadbets with this provider. You should consider whether you understand how CFDs and Spreadbets work and whether you can afford to take the high risk of losing your money.
USDJPY Technical Analysis | JPY Reacts to BoJ Governor's Rate Remarks
BY Janne Muta
|December 8, 2023USDJPY Technical Analysis - USDJPY experienced a nearly 4% drop yesterday following comments made by BoJ Governor Ueda that sparked speculation about a potential interest rate hike in Japan before the year's end. Presently, Japan's overnight interest rate stands at -0.10%, but it has been trading closer to -0.01%.
Discussions have arisen regarding the timing and approach to moving away from negative interest rates, with some suggesting that the BOJ should take action pre-emptively to avoid market pressure.
Earlier, Japan's core consumer price index for October, which excludes fresh food but includes fuel costs, rose by 2.9% compared to the previous year. This represents a slight acceleration from the 2.8% gain in September but fell short of the expected 3% increase.
Nonetheless, this core inflation figure has exceeded the Bank of Japan's 2% target for the nineteenth consecutive month, leading to questions about the central bank's commitment to its ultra-easy monetary policy.
According to GDP data released today, it would be challenging for the BoJ to tighten its monetary policy. The Japanese economy contracted by 2.9% on an annualized basis during the third quarter of 2023, in contrast to preliminary data indicating a 2.1% decline and a downwardly revised 3.6% growth in Q2.
This marks the first yearly contraction in economic activity in a year and the sharpest decline since the height of the pandemic in Q2 of 2020. This contraction reflects the fragility of the recovery due to uncertainties stemming from elevated inflation and a murky global economic outlook.
Private consumption remained weak, while business spending declined for the second consecutive quarter. Additionally, net trade had a negative impact on GDP, with imports growing faster than exports.
This suggests that the markets may have overreacted, and in the short term, USDJPY could continue the mean reversion trade that began yesterday. Today's primary focus will be on the NFP release, with analysts forecasting 180K new jobs (compared to the prior figure of 150K). For a more detailed analysis of US employment data, please refer to our NFP Preview Report.
Summary of This USDJPY Technical Analysis Report:
- USDJPY experienced a significant decline after the market broke below the lower boundary of the bullish channel yesterday. The market breached a critical market structure zone between 144.44 and 145.07 before plummeting to 141.71, followed by a sharp reversal yesterday.
- The substantial increase in volatility makes it challenging to predict potential market directions on the daily chart. However, if the market can convincingly surpass 145.07, we may witness an advance towards 146. Conversely, according to USDJPY technical analysis, there is a likelihood that the market could move down to the range of 141.71 to 142.50.
- A measured move target, based on the higher reactionary low and the preceding swing high in the 1h chart, is at 146.30. It's worth noting, however, that there is a technical confluence zone between 145.29 and 145.60. This zone encompasses the upper boundary of the bullish channel, a resistance level, and the 50-period moving average, all suggesting that it might be an area of interest for intraday traders.
Read the full USDJPY Technical Analysis report below.
USDJPY Technical Analysis

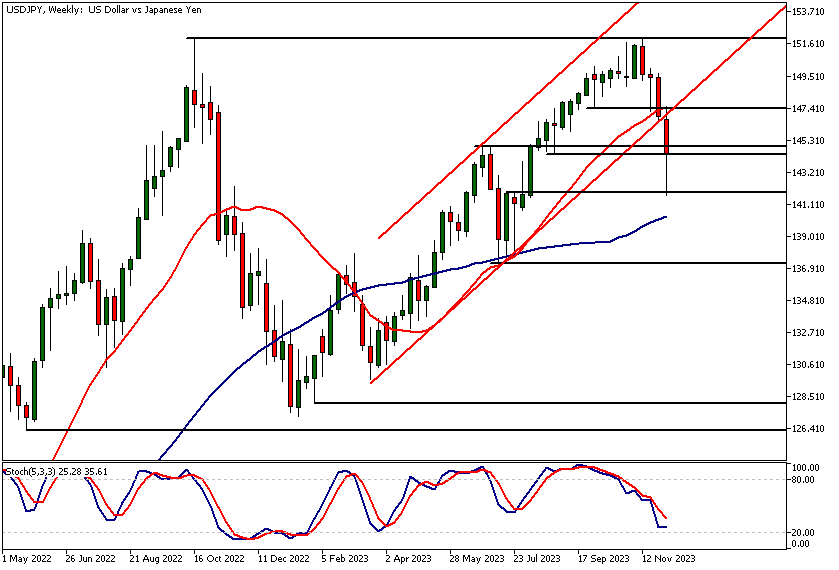
USDJPY Technical Analysis, Weekly Chart
USDJPY experienced a significant decline after the market broke below the lower boundary of the bullish channel yesterday. The market breached a critical market structure zone between 144.44 and 145.07 before plummeting to 141.71, followed by a sharp reversal yesterday.
During this process, the stochastic oscillator entered oversold territory, signalling a potential buying opportunity. Indicator-based USDJPY technical analysis still suggests a bullish market outlook, with moving averages pointing upward, especially the 20-period moving average well above the 50-period SMA.
Volatility increase
However, the sudden surge in downside volatility raises doubts about this indication, as increased volatility in either direction often leads to further fluctuations. Consequently, the market may experience significant oscillations before resuming its upward trend. Although an immediate uptrend resumption is possible, it is not highly likely, and thus, risks remain elevated.
Furthermore, the market has recently formed a double top pattern within this timeframe, accompanied by a bearish breakout from the ascending price channel. Given this context, an immediate return to the uptrend seems improbable.

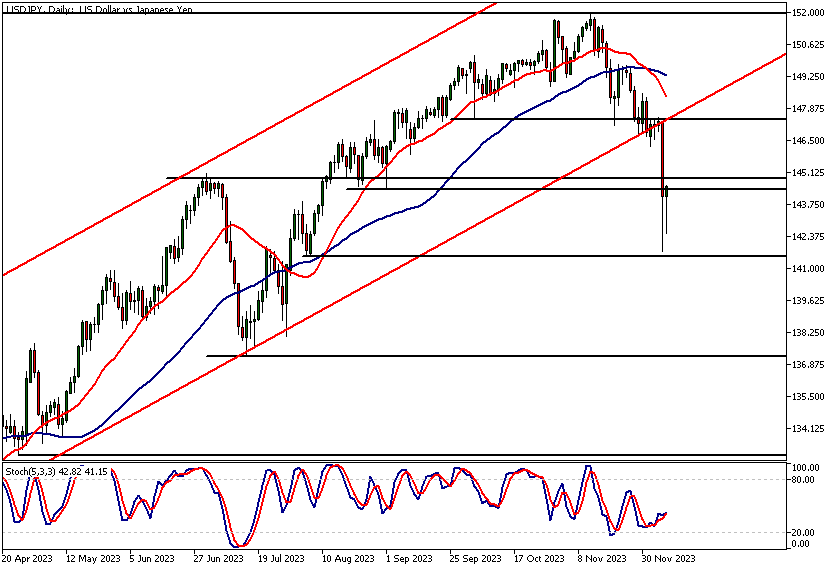
USDJPY Technical Analysis, Daily Chart
Yesterday buying interest emerged above a minor support level at 141.55, which was established in August. At the time of writing, the market has rallied back to the market structure zone mentioned in the weekly USDJPY technical analysis section (144.44 - 145.07).
The substantial increase in volatility makes it challenging to predict potential market directions on the daily chart. However, if the market can convincingly surpass 145.07, we may witness an advance towards 146. Conversely, according to USDJPY technical analysis, there is a likelihood that the market could move down to the range of 141.71 to 142.50.

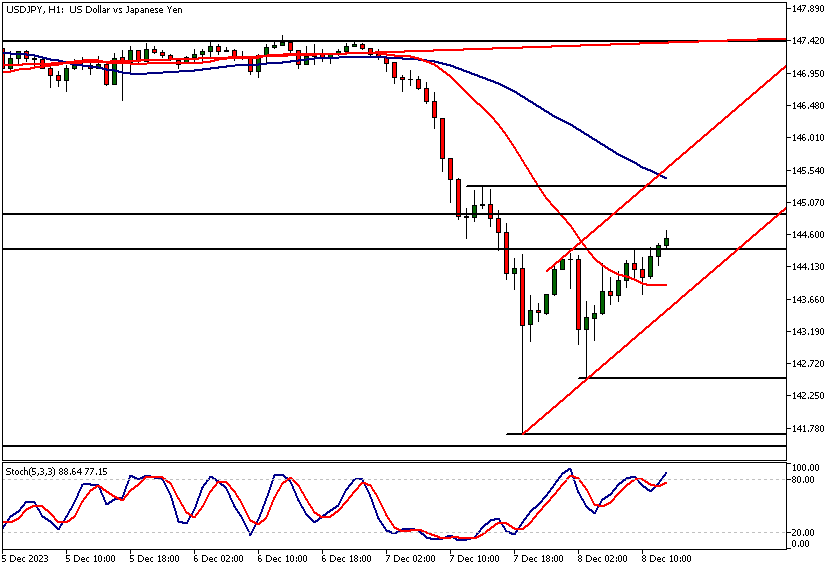
USDJPY Technical Analysis, 1h Chart
A one hour analysis reveals that USDJPY has established a higher swing low at 142.50. This development has encouraged USD bulls to push the market into the range of 144.44 - 145.07. If the market maintains its strength, a move towards 146 is possible.
Measured move target
A measured move target, based on the higher reactionary low and the preceding swing high, is at 146.30. It's worth noting, however, that there is a technical confluence zone between 145.29 and 145.60. This zone encompasses the upper boundary of the bullish channel, a resistance level, and the 50-period moving average, all suggesting that it might be an area of interest for intraday traders.
Therefore, based on our USDJPY technical analysis, there is a risk of increased selling pressure within this confluence area.

Client sentiment analysis
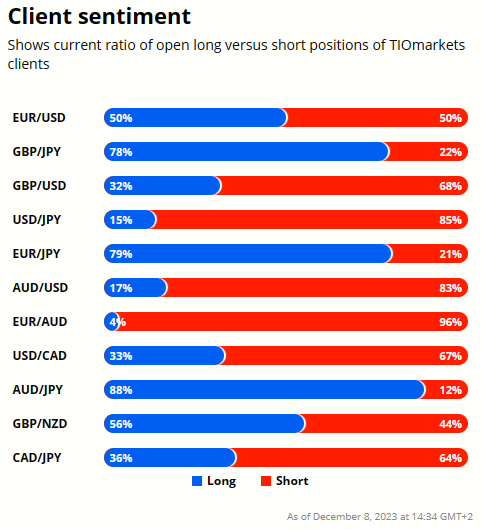
TIOmarkets clients are extremely bearish on USDJPY with 85% of clients holding short positions and only 15% holding long positions in the market.
Please remember that the retail trader client sentiment is a contrarian indicator as most of the retail traders are on average betting against the market trends. This is why, experienced traders tend to trade against the retail client sentiment. You can follow the TIOmarkets client sentiment live on our Forex dashboard.
The next key risk events impacting this market
- USD - Average Hourly Earnings
- USD - Non-Farm Employment Change
- USD - Unemployment Rate
- USD - Prelim UoM Consumer Sentiment
- USD - Prelim UoM Inflation Expectations
Potential USDJPY Market Moves
If the market can convincingly surpass 145.07, we may witness an advance towards 146. Conversely, according to USDJPY technical analysis, there is a likelihood that the market could move down to the range of 141.71 to 142.50.

How would you trade the USDJPY today?
I hope this USDJPY technical analysis helps you to make better informed trading decisions. Check the latest market analysis for other instruments and subscribe to receive them in your inbox as soon as they are published
While research has been undertaken to compile the above content, it remains an informational and educational piece only. None of the content provided constitutes any form of investment advice.
TIO Markets UK Limited is a company registered in England and Wales under company number 06592025 and is authorised and regulated by the Financial Conduct Authority FRN: 488900
Risk warning: CFDs are complex instruments and come with a high risk of losing money rapidly due to leverage. 73% of retail investor accounts lose money when trading CFDs with this provider. You should consider whether you understand how CFDs work and whether you can afford to take the high risk of losing your money. Professional clients can lose more than they deposit. All trading involves risk.
DISCLAIMER: TIO Markets offers an exclusively execution-only service. The views expressed are for information purposes only. None of the content provided constitutes any form of investment advice. The comments are made available purely for educational and marketing purposes and do NOT constitute advice or investment recommendation (and should not be considered as such) and do not in any way constitute an invitation to acquire any financial instrument or product. TIOmarkets and its affiliates and consultants are not liable for any damages that may be caused by individual comments or statements by TIOmarkets analysis and assumes no liability with respect to the completeness and correctness of the content presented. The investor is solely responsible for the risk of his/her investment decisions. The analyses and comments presented do not include any consideration of your personal investment objectives, financial circumstances, or needs. The content has not been prepared in accordance with any legal requirements for financial analysis and must, therefore, be viewed by the reader as marketing information. TIOmarkets prohibits duplication or publication without explicit approval.

Janne Muta holds an M.Sc in finance and has over 20 years experience in analysing and trading the financial markets.
