Risk disclaimer: 76% of retail investor accounts lose money when trading CFDs and Spreadbets with this provider. You should consider whether you understand how CFDs and Spreadbets work and whether you can afford to take the high risk of losing your money.
Silver Technical Analysis | XAGUSD Retreats: Key Support Levels to Watch
BY Janne Muta
|December 5, 2023Silver Technical Analysis – The silver market has been strong until yesterday's reaction lower as strong industrial demand for silver in key sectors such as photovoltaics, electronics, and 5G networks provide support to the market. Industrial demand is expected to remain as the a significant supply shortage underpins the silver prices.
The notable 3.6% decline in US factory orders for October likely exerted pressure on the silver market, given silver's role as an industrial metal. This decline marked the most significant drop since April 2020 and was unexpected. It is attributed to the challenges stemming from elevated interest rates and inflation.
Notably, orders for transportation equipment, especially nondefense aircraft and parts, experienced a steep decline of 14.7%. However, there were minor improvements in orders for fabricated metal products and computers/electronic products, which if continued, is likely to provide support the silver market in the long-run.
This data highlights the widespread impact of heightened inflation and increased interest rates, prompting market participants to anticipate more accommodative policy responses from the Federal Reserve.
Summary of This Silver Technical Analysis Report:
- Silver didn't quite reach the April high of 26.13 when it rallied higher alongside Gold. The market has shown a relatively strong correlation with XAUUSD recently, but while the gold market moved to new all-time high (ATH) levels, silver remained below this crucial weekly resistance level.
- In the daily chart, the nearest market structure area can be identified between 24.00 and 24.14, with the 20-day Simple Moving Average (SMA) relatively close at 23.85. Given the strong downward momentum observed yesterday, a test of this area could be likely.
- On the 8-hour chart, the market has retraced sufficiently to push the stochastic oscillator into the oversold region. The most recent complete 8-hour candle is a bullish rejection candle, indicating that some traders find the current price levels attractive and have bought into the market. However, confirmation with follow-through buying is necessary to validate this indication, and currently, the market is still drifting lower.
Read the full Silver technical analysis report below.
Silver Technical Analysis

Weekly Silver Technical Analysis
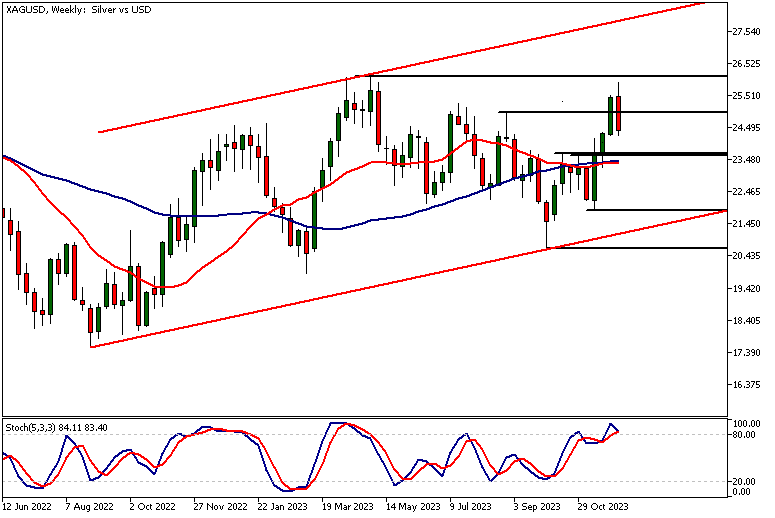
Silver didn't quite reach the April high of 26.13 when it rallied higher alongside Gold. The market has shown a relatively strong correlation with XAUUSD recently, but while the gold market moved to new all-time high (ATH) levels, silver remained below this crucial weekly resistance level.
Currently, the market is trading lower toward the key market structure area at 23.60 - 23.70. If silver forms a higher reactionary low above the closely aligned moving averages at 23.44, the market will maintain a bullish stance on the weekly timeframe chart. Alternatively, according to silver technical analysis, there is a possibility that the market could decline to 23 and potentially even to 22.60 on an extension.

Daily Silver Technical Analysis
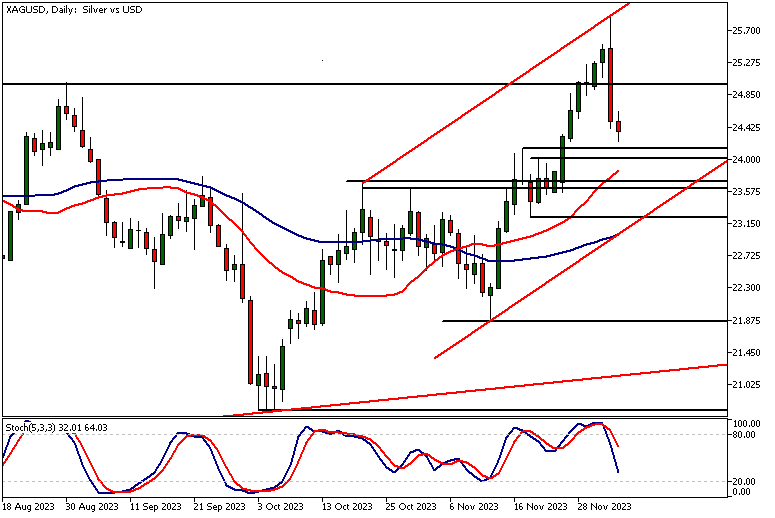
In the daily chart, the nearest market structure area can be identified between 24.00 and 24.14, with the 20-day Simple Moving Average (SMA) relatively close at 23.85.
Indicator-based silver technical analysis suggests that the market remains medium-term bullish despite the significant drop yesterday. However, it's possible that the market may need to retrace further before the uptrend can resume.
Bullish trend channel
The market continues to exhibit a bullish trend within the ascending trend channel. It's worth noting that the SMA(50) aligns with the lower boundary of the channel. The closest key resistance level is yesterday's high at 25.91.

Silver Technical Analysis, 8h
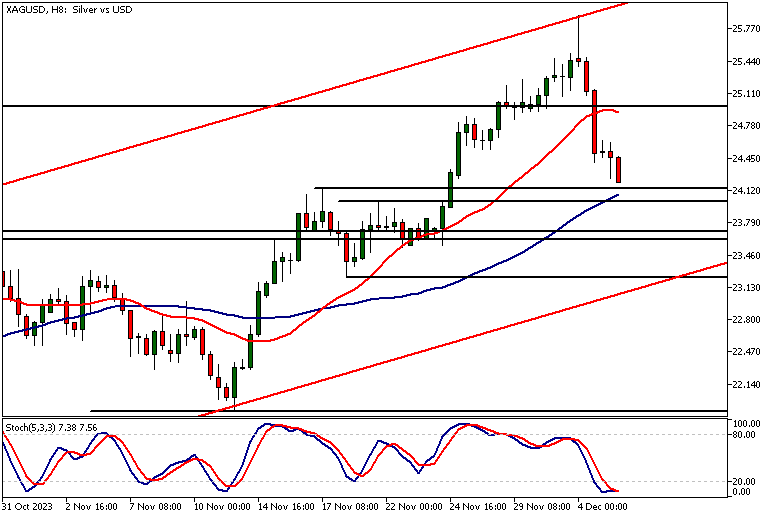
On the 8-hour chart, the market has retraced sufficiently to push the stochastic oscillator into the oversold region. The most recent complete 8-hour candle is a bullish rejection candle, indicating that some traders find the current price levels attractive and have bought into the market.
However, confirmation with follow-through buying is necessary to validate this indication, and currently, the market is still drifting lower.
Moving average indications
There's a possibility of a move down to the SMA(50), which is currently positioned between the nearest market structure levels. Based on indicator-driven silver technical analysis, the market remains bullish, with the SMA(20) above the SMA(50).

Client sentiment analysis
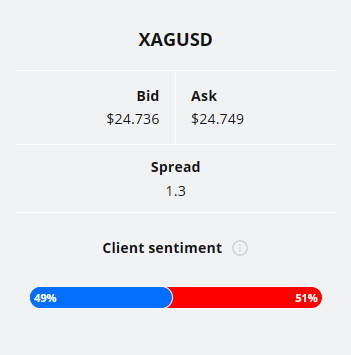
The TIOmarkets client sentiment doesn't provide indication on retail trader sentiment as 51% of traders are short and 49% long.
Please remember that the retail trader client sentiment is a contrarian indicator as most of the retail traders are on average betting against the market trends. This is why, experienced traders tend to trade against the retail client sentiment. You can follow the TIOmarkets client sentiment live on our Forex dashboard.
The next key risk events impacting this market
- USD - ADP Non-Farm Employment Change
- USD - Unemployment Claims
- USD - Average Hourly Earnings
- USD - Non-Farm Employment Change
- USD - Unemployment Rate
- USD - Prelim UoM Consumer Sentiment
- USD - Prelim UoM Inflation Expectations
Potential Silver Market Moves
Market remains bullish if it forms a higher low above 23.44 making a retest of yesterday's high possible. Alternatively, we could see a move down to 23 and then possibly 22.60 on extension.

How would you trade the Silver today?
I hope this silver technical analysis helps you to make better informed trading decisions. Check the latest market analysis for other instruments and subscribe to receive them in your inbox as soon as they are published
While research has been undertaken to compile the above content, it remains an informational and educational piece only. None of the content provided constitutes any form of investment advice.
TIO Markets UK Limited is a company registered in England and Wales under company number 06592025 and is authorised and regulated by the Financial Conduct Authority FRN: 488900
Risk warning: CFDs are complex instruments and come with a high risk of losing money rapidly due to leverage. 73% of retail investor accounts lose money when trading CFDs with this provider. You should consider whether you understand how CFDs work and whether you can afford to take the high risk of losing your money. Professional clients can lose more than they deposit. All trading involves risk.
DISCLAIMER: TIO Markets offers an exclusively execution-only service. The views expressed are for information purposes only. None of the content provided constitutes any form of investment advice. The comments are made available purely for educational and marketing purposes and do NOT constitute advice or investment recommendation (and should not be considered as such) and do not in any way constitute an invitation to acquire any financial instrument or product. TIOmarkets and its affiliates and consultants are not liable for any damages that may be caused by individual comments or statements by TIOmarkets analysis and assumes no liability with respect to the completeness and correctness of the content presented. The investor is solely responsible for the risk of his/her investment decisions. The analyses and comments presented do not include any consideration of your personal investment objectives, financial circumstances, or needs. The content has not been prepared in accordance with any legal requirements for financial analysis and must, therefore, be viewed by the reader as marketing information. TIOmarkets prohibits duplication or publication without explicit approval.

Janne Muta holds an M.Sc in finance and has over 20 years experience in analysing and trading the financial markets.
