Risk disclaimer: 76% of retail investor accounts lose money when trading CFDs and Spreadbets with this provider. You should consider whether you understand how CFDs and Spreadbets work and whether you can afford to take the high risk of losing your money.
Oil technical analysis | USOIL up 40% since April low
BY Janne Muta
|September 15, 2023Oil technical analysis in today’s market is particularly important as the USOIL market is still absorbing the ramifications of Saudi Arabia and Russia's recent decision to extend oil production cuts. Also, the triple witching day means there’s a higher probability for added volatility. Triple witching today, could increase volatility due to the simultaneous expiration of futures and options contracts in the oil derivatives markets.
Recent Trends and Historical Context
After breaking out of a bearish trend channel in July, USOIL has rallied impressively, with gains of over 16%. The market has also rallied 40% since its April low. However, a note of caution is warranted: historical oil technical analysis suggests that such robust gains often precede slower market movement.
Technical Indicators
That’s because key resistance levels tend to be nearer after strong rallies. In the daily and 4h timeframes, bullish indicators prevail, yet with overbought conditions signalling potential pullbacks.
Market Dynamics
The report also covers broader market dynamics, including sustained gains in oil prices attributed to extended production cuts, rising global demand with a notable contribution from China, dwindling inventory levels, and price stability despite recent volatility.
The key takeaways:
- The International Energy Agency (IEA) forecasts global oil demand to rise by 2.2 million barrels per day in 2023. Extended production cuts by Saudi Arabia and Russia are expected to maintain a market deficit, impacting short-term price movements.
- China, the world's second-largest consumer of crude oil, is expected to significantly contribute to global oil demand. Recent data, including industrial output and retail sales, indicate a stabilising economic recovery, reinforcing the upward trend in China's oil consumption.
- The weekly chart shows USOIL rallying impressively, with gains of over 16% from its channel highs and 40% since its April low. The next major resistance level is only 2.8% away from the current market price. The Stochastic Oscillator indicates the market is in overbought territory, suggesting caution for traders.
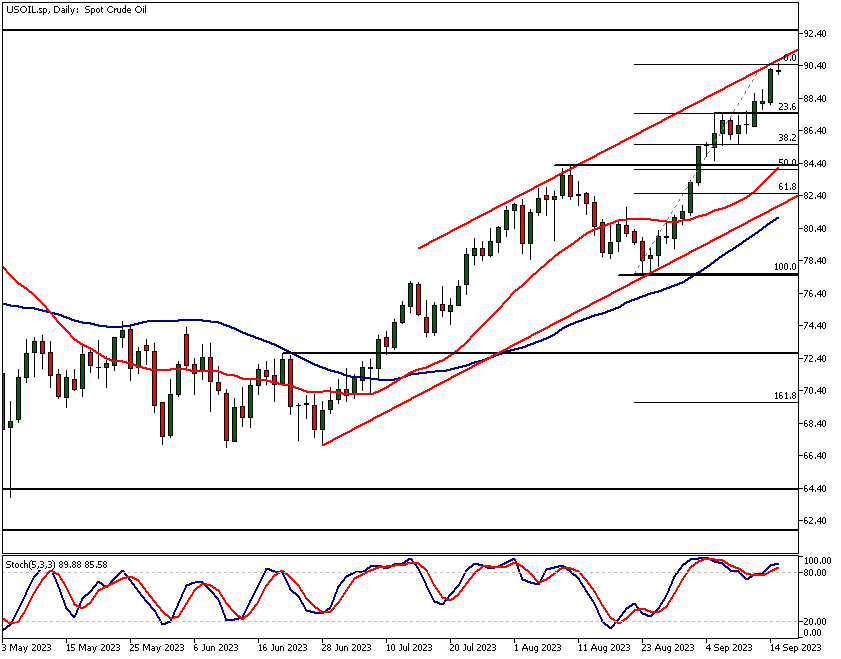
- In the daily timeframe, USOIL is trading right below the high of a bullish price channel. The next key support level is at 87.53, coinciding with the 23.6% Fibonacci retracement level. If this level breaks, focus shifts to the 38.2% level at 85.64.
- Both the Stochastic Oscillator and SMA(20) indicate overbought conditions, aligning with USOIL being near the channel high. These are mere indications and require price action confirmation, especially important on today's triple witching day.
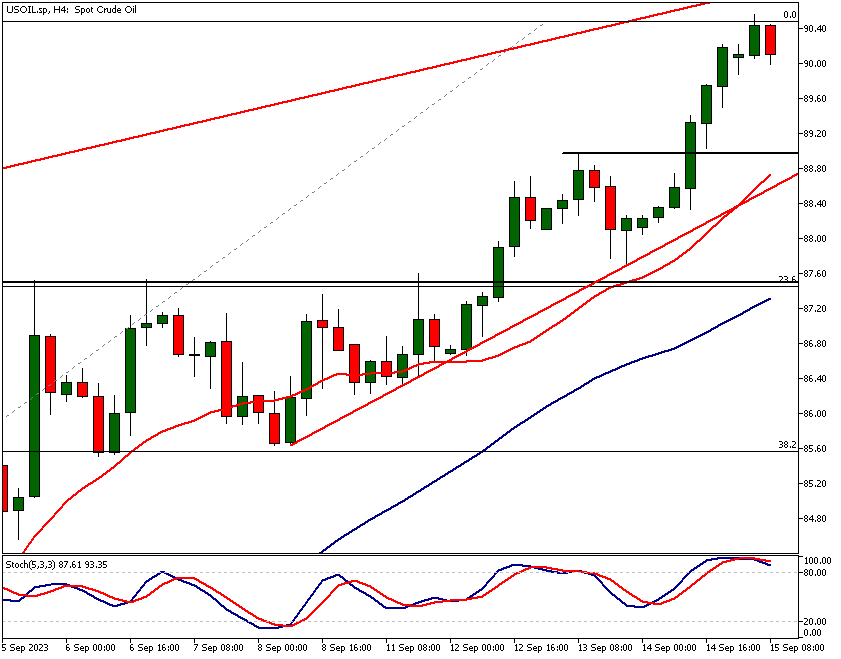
- The 4h chart shows bullish momentum with SMAs trending higher. The next 4h support level is at 88.97, closely aligning with the SMA(20) at 88.73. The potential for added volatility today makes these levels critical for intraday traders.
The next key risk events for USOIL market are Empire State Manufacturing Index, US Industrial Production, Prelim UoM Consumer Sentiment, Prelim UoM Inflation Expectations.
Read the full oil technical analysis report below.
Oil technical analysis
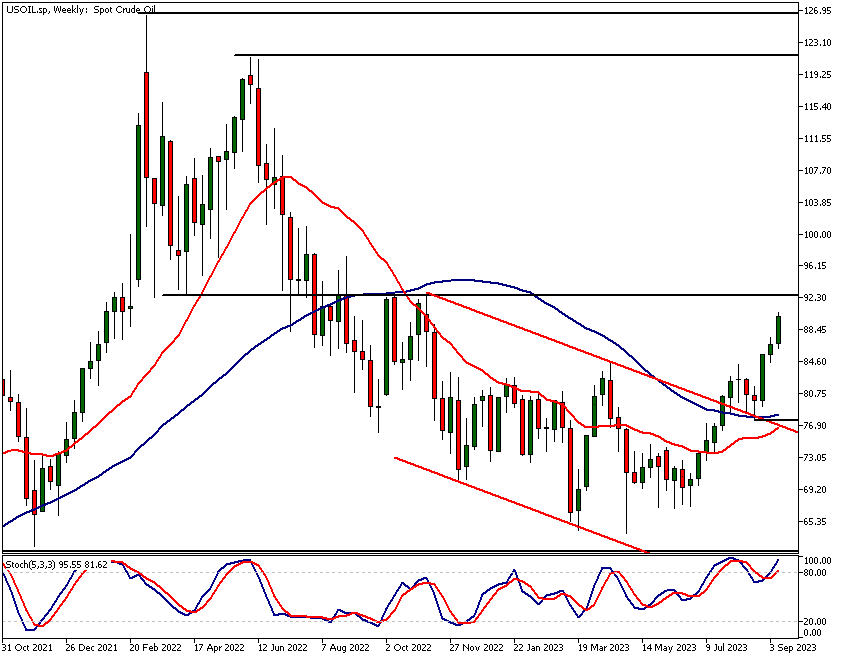
Oil technical analysis, weekly chart
After trending lower for the best of part of the year USOIL has broken out of a bearish trend channel. After the bullish breakout the market tested the channel high (77.50) successfully and has since then rallied over 16%.
The rally from the April low has been impressive: plus 40%. Over the last three weeks alone USOIL has rallied 11%, a substantial move higher in such a short period of time. Such price moves are quite rare.
Historical Patterns and Market Sluggishness
It is noteworthy also, that oil technical analysis with historical prices shows the market moving (on average) more sluggishly immediately after such a strong move has taken place. Therefore, we should not expect to see another 11% or similar push higher now. The reason is that after big price moves the next key resistance levels tend to be near. This is true also in this case. The next major resistance level is only 2.8% away from the current market price.
The Significance of Major Resistance Levels
The rally has taken the market almost to the major resistance level (84.04) that resulted in a substantial drop in oil price in October 2022. The market declined almost 19% in just three weeks. Furthermore, the same price level acted as support level in April 2022, sending the price of oil higher by 30%. Therefore, the area around the 84 dollar level is a psychologically significant price level and most likely keenly followed by analysts and traders alike.
Psychological Price Levels and Market Sentiment
Price reactions around psychologically important price levels can help us to understand what the market sentiment is and how much of the current news flow and macroeconomic factors is priced in the oil market.
Stochastic Oscillator and Market Momentum
As per oil technical analysis the Stochastic Oscillator is firmly in the overbought territory, but it’s worth noting that in uptrends the oscillators can be overbought for quite some time. Therefore, this alone is not a reason to sell the market short. The current upside momentum in the weekly chart is strong and that is the reason for the strength in the oscillator too.
Oil technical analysis, daily chart
In the daily timeframe chart USOIL is trading right below the high of a bullish price channel. While the market is bullish this is a bearish factor as it could show down the price advance or even create a pullback.
Should a pullback occur, the next key support level is at 87.53. This level coincides with the 23.6% Fibonacci retracement level creating a technical confluence level.
If the level gives in, we should focus on the 38.2% Fibonacci level at 85.64 and the 50% level at 84.03. This level aligns closely with a market structure level at 84.30 and with the SMA(20) at 84.14. Therefore, the 84 region is likely to be a highly significant support area.
Moving Averages and Overbought Indications
Both moving averages are pointing higher and are in a bullish order: The SMA(20) is above the SMA(50). The Stochastic Oscillator is above the 80 level signalling the market is overbought. This indication aligns with the market being near the channel high and thus overbought as per price channel analysis.
The Importance of Price Action Confirmation
These are, as always, just indications until we see the price action confirming them. In other words, they alone do not warrant short trades in a bull market. Traders need to confirm any indications by the price action itself. It is the only reliable (enough) indicator as it represents the opinion of all traders and investors put together.
Triple Witching Day and its Impact
Note that today is what is known as triple witching day in the markets. The typical impact of triple witching on the USOIL market is an increase in trading volume and volatility. This is because traders need to buy or sell oil futures contracts in order to fulfil their obligations under the expiring options contracts.
Intraday Trading Considerations
Therefore, intraday traders should pay attention to our 4h oil technical analysis today especially as the potential for added volatility could translate to better trading opportunities. However, if there are no trading opportunities it is better to stay in a cash position and wait for high-quality opportunities to arise.
Oil technical analysis, 4h chart
The 4h oil technical analysis shows the market bullish with the SMAs trending higher (in the bullish order) and the price trading above them. However, the bids have softened slightly over the last 4h period.
If the weakness continues we might see a move down to the next 4h support level (88.97). The level roughly coincides with the SMA(20) at 88.73 and a rising trendline support at 88.60.
Note also that the SMA(50) in the 4h chart aligns closely with the 23.6% Fibonacci retracement level we studied in the daily timeframe oil technical analysis.
Client sentiment analysis
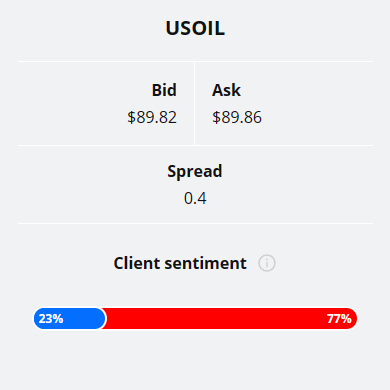
77% of TIOmarkets' clients are bearish on USOIL with only 23% holding a long position.
Please remember that the retail trader client sentiment is a contrarian indicator as most of the retail traders are on average betting against the market trends. This is why, experienced traders tend to trade against the retail client sentiment. You can follow the TIOmarkets client sentiment live on our Forex dashboard.
USOIL fundamental overlay
Oil prices have recently experienced a rally, marking them for a third successive week of gains. The escalation is predominantly attributed to Saudi Arabia and Russia's extension of their oil production cuts until the end of 2023. The International Energy Agency (IEA) forecasts that this action will engender a considerable market deficit throughout the rest of the year.
Global Demand and Market Deficit
In its Oil Market Report, the IEA outlines that the global oil demand is expected to rise by 2.2 million barrels per day (mb/d) in 2023, amounting to 101.8 mb/d. China is slated to be a major contributor to this growth. Furthermore, the extended output cuts by Saudi Arabia and Russia are set to maintain a market deficit.
To help you to navigate the oil market and to understand the impact of fundamentals in the price of oil we will keep USOIL on our watchlist and provide you with oil technical analysis again on constant basis.
Inventory Levels and Price Stability
Global oil inventories have witnessed a steep decline, registering a 13-month low as of August. While oil prices have generally remained stable, they experienced an increase towards the end of the month, breaching the $90/barrel mark for the first time in nearly a year.
China's Role in Oil Demand
The outlook for global oil demand is particularly buoyant in China, the world's second-largest consumer of crude oil. Recent economic data from China, including better-than-expected results for industrial output and retail sales in August, indicate a stabilising post-COVID-19 economic recovery. This lends further credence to the expectation that China's oil consumption will continue its upward trend.
The key findings of the oil technical analysis report
- USOIL is nearing a major resistance level at 84.04, which historically led to a 19% market decline in October 2022. Watch this level closely for potential price reversals or breaks.
- Today is a triple witching day in the oil markets, typically resulting in increased trading volume and volatility. Traders need to be cautious and watch for sudden price movements as futures and options contracts expire.
- The Stochastic Oscillator on the weekly USOIL chart is in the overbought territory above 80. While this is not a sell signal in an uptrend, it suggests caution for potential market pullbacks.
- In the daily timeframe, USOIL is trading right below the high of a bullish price channel. The next key support level is at 87.53, closely aligned with the 23.6% Fibonacci retracement and SMA(20) at 84.14.
- The 4h chart indicates a slight softening in bids. If this continues, the next support level to watch is at 88.97, which coincides with the SMA(20) at 88.73 and a rising trendline at 88.60.
- The extended oil production cuts by Saudi Arabia and Russia are contributing to sustained gains in oil prices. The IEA forecasts a market deficit for 2023, driven by a rise in global demand, notably from China.

The next main risk events
- USD - Empire State Manufacturing Index
- USD - Industrial Production
- USD - Prelim UoM Consumer Sentiment
- USD - Prelim UoM Inflation Expectations
For more information and details see the TIOmarkets economic calendar.
While research has been undertaken to compile the above content, it remains an informational and educational piece only. None of the content provided constitutes any form of investment advice.
Tio Markets UK Limited is a company registered in England and Wales under company number 06592025 and is authorised and regulated by the Financial Conduct Authority FRN: 488900
Risk warning: CFDs are complex instruments and come with a high risk of losing money rapidly due to leverage. 82% of retail investor accounts lose money when trading CFDs with this provider. You should consider whether you understand how CFDs work and whether you can afford to take the high risk of losing your money. Professional clients can lose more than they deposit. All trading involves risk.
DISCLAIMER: Tio Markets offers an exclusively execution-only service. The views expressed are for information purposes only. None of the content provided constitutes any form of investment advice. The comments are made available purely for educational and marketing purposes and do NOT constitute advice or investment recommendation (and should not be considered as such) and do not in any way constitute an invitation to acquire any financial instrument or product. TIOmarkets and its affiliates and consultants are not liable for any damages that may be caused by individual comments or statements by TIOmarkets analysis and assumes no liability with respect to the completeness and correctness of the content presented. The investor is solely responsible for the risk of his/her investment decisions. The analyses and comments presented do not include any consideration of your personal investment objectives, financial circumstances, or needs. The content has not been prepared in accordance with any legal requirements for financial analysis and must, therefore, be viewed by the reader as marketing information. TIOmarkets prohibits duplication or publication without explicit approval.

Janne Muta holds an M.Sc in finance and has over 20 years experience in analysing and trading the financial markets.
