Risk disclaimer: 76% of retail investor accounts lose money when trading CFDs and Spreadbets with this provider. You should consider whether you understand how CFDs and Spreadbets work and whether you can afford to take the high risk of losing your money.
NZDCHF analysis | Weakness Ahead of RBNZ Rate Decision
BY Janne Muta
|October 3, 2023NZDCHF Analysis - The NZDCHF currency pair finds itself at a pivotal point, shaped by the differing economic conditions in New Zealand and Switzerland. Both countries are contending with inflation, albeit at disparate levels, prompting their central banks to exercise caution in their monetary policies. The RBNZ rate decision tomorrow and the CPI data released from Switzerland makes our NZDCHF analysis very timely and critical.
Weekly Chart Technical Insights
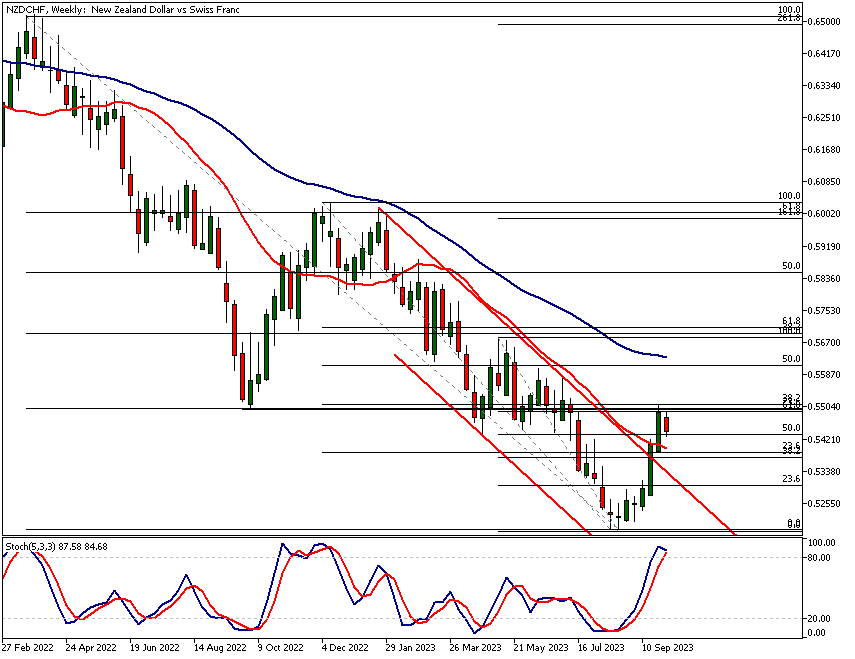
On the weekly chart, the NZDCHF market has successfully broken free from a bearish trend. However, it has encountered resistance at a crucial confluence area formed by a Fibonacci cluster. This resistance level has proven to be a significant barrier for bullish traders, leading to a market pullback.
Daily Chart Observations
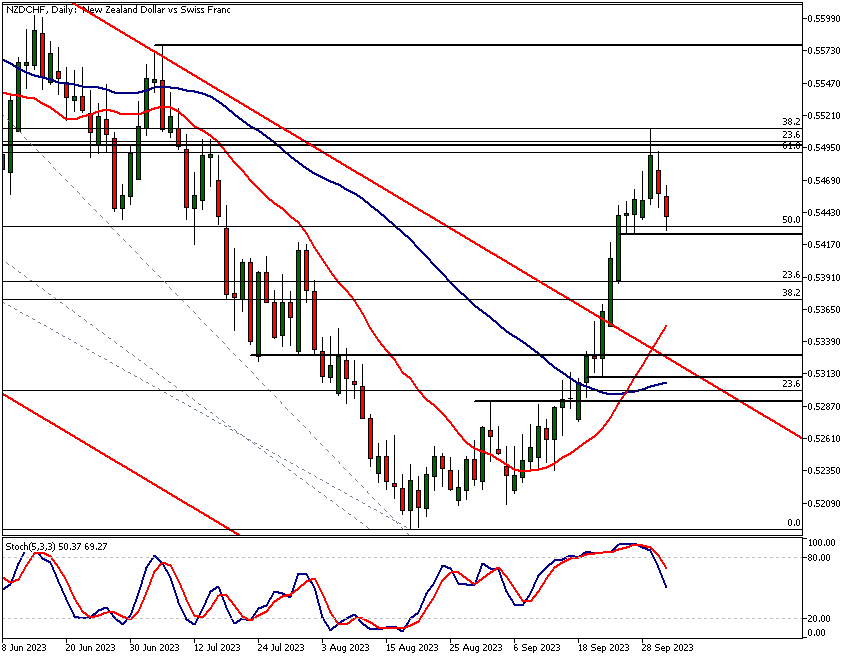
The daily chart paints a nuanced picture, showing the currency pair trading close to a minor support level. This level is particularly noteworthy because it aligns closely with a 50% Fibonacci retracement level, adding to its significance as a potential turning point for the market.
The NZDCHF analysis report, key takeaways:
- The weekly NZDCHF chart shows a breakout from a bearish trend, facing resistance at a critical Fibonacci cluster around 0.5501. The Stochastic Oscillator is above 80, indicating potential overbought conditions.
- On the daily chart, NZDCHF is trading near a minor support level at 0.5426, closely aligned with a 50% Fibonacci retracement level. An inside candle formation suggests bearish sentiment.
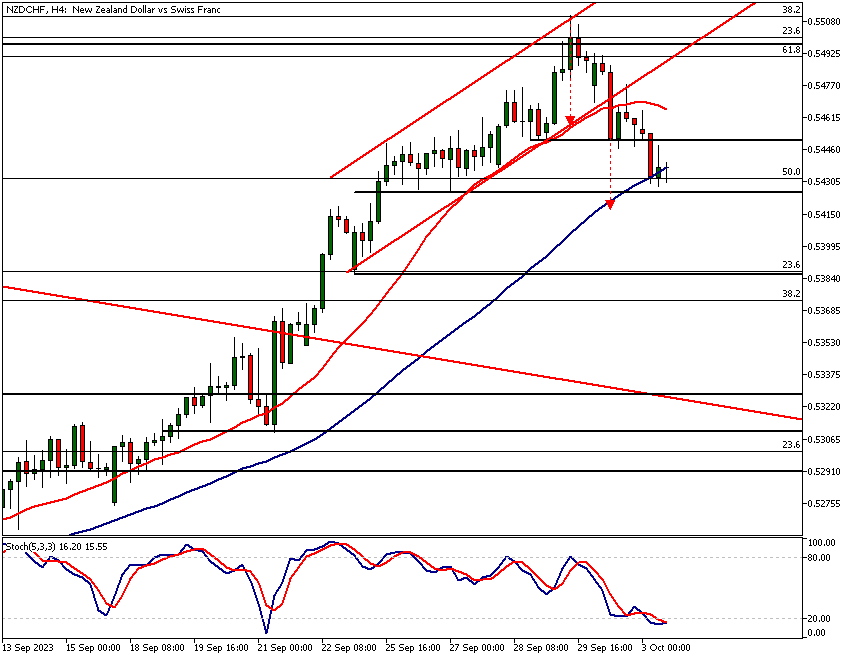
- The 4-hour NZDCHF chart reveals a failure to maintain a bullish trend channel. The market is trading between minor daily support at 0.5426 and 4-hour resistance at 0.5451.
- New Zealand's inflation rate stands at 4.95%, compelling the RBNZ to maintain an official cash rate of 5.5%. Switzerland's inflation is at 1.7%, with the SNB keeping its rate at 1.75%.
- New Zealand's ANZ Business Outlook Index has turned positive, but key indicators like exports and employment are declining. Switzerland shows a robust current account surplus of CHF 20 billion in Q2 2023.
- The Stochastic Oscillator on the 4-hour NZDCHF chart is in the oversold area below 20. Despite this, bearish indicators on the daily and weekly charts suggest caution for traders.
The next key risk events for NZDCHF are
- NZD - Rate decision
- NZD - RBNZ Rate Statement
- CHF - Foreign Currency Reserves
NZDCHF analysis
NZDCHF analysis, weekly chart
In the weekly NZDCHF chart, the market has broken out of a bearish trend channel and rallied to a critical resistance area (0.5501 - 0.5510). This technical confluence area was created by a historical resistance level at 0.5501 and a cluster of Fibonacci levels that coincided within the above-mentioned range. The market has since reacted lower from this level as the supply was too much for the bulls to absorb.
Fibonacci Cluster Analysis and Resistance Levels
Using Fibonacci cluster analysis together with historical support and resistance levels, we can reveal highly significant support and resistance areas. Utilising NZDCHF swing highs from March 2022, December 2022, and May 2023, we can use this method to form clusters of Fibonacci levels.
One of these clusters coincides with a historical resistance level at 0.5501 and stopped the market advance last week. Now, NZDCHF is trading lower from this resistance area.
The stochastic oscillator is above the 80 level and could soon give a NZDCHF sell signal. The 20 and 50-period moving averages are still pointing lower, with the fast SMA below the slow. Therefore, the weekly NZDCHF technical analysis indicators suggest further near-term weakness in NZDCHF.
Market Reversal Possibilities
However, at the same time, we should remember that the market has just broken out of a bearish trend channel. This might result in the NZDCHF currency pair creating a higher reactionary low above the low that the market created in August. In other words, the recent upside momentum could indicate an attempt to create a market reversal in NZDCHF.
Potential Support Levels and Price Action
The nearest potential support level is the technical confluence area created by the SMA(20) and a minor cluster of Fibonacci retracement levels at 0.5374 – 0.5400. If NZDCHF retraces back to this range, monitor the price action to see whether the NZD bulls are willing to buy inside the level or whether the market just continues to trade lower.
Future Outlook and Trader Guidance
Future market reversals obviously remain (as always) subject to further NZDCHF price action and requires an updated NZDCHF analysis over the next weeks. Given these factors, the current NZDCHF sentiment is mixed, and traders are advised to decide whether to buy or sell NZDCHF based on comprehensive NZDCHF analysis updated on a daily basis.
NZDCHF analysis, daily chart
The daily NZDCHF chart shows the market trading near a minor support level (0.5426) that is somewhat closely aligned with one of the 50% Fibonacci retracement levels drawn in the weekly Fibonacci retracement cluster analysis.
Inside Candle and Market Sentiment
Yesterday, the market created an inside candle which, in the context of the market trading near a key resistance area, is a bearish indication. This could be a crucial point in deciding whether to buy or sell NZDCHF. If the weakness in NZDCHF continues and the minor support level gets broken, we might see a move down to the next Fibonacci cluster (0.5374 – 0.5400) and then possibly to 0.5322 on extension.
Potential Rally and Updated Predictions
If NZDCHF ends up rallying above Friday’s high (0.5511), the market could move to 0.5577. This would necessitate an updated NZDCHF prediction.
Oscillator and Moving Averages
The Stochastic Oscillator has given a sell signal yesterday, which is noteworthy NZDCHF news, but at the same time, the SMA (20) has crossed above the SMA (50). Both the moving averages are now pointing higher, but this is mainly due to the strong rally seen in the market over the previous weeks.
This is yet another reminder of how the market swings determine the moves in the oscillators and moving averages. Therefore, they can act as highlighters, but the real market signals come from the NZDCHF price action itself.
Current Sentiment and Future Analysis
Given these dynamics, the current NZDCHF sentiment is mixed. Traders should closely monitor future NZDCHF technical analysis today and in the coming weeks to make informed decisions.
NZDCHF analysis, 4h chart
The daily NZDCHF chart shows the market trading near a minor support level (0.5426) that is somewhat closely aligned with one of the 50% Fibonacci retracement levels drawn in the weekly Fibonacci retracement cluster analysis.
Inside Candle and Market Sentiment
Yesterday, the market created an inside candle which, in the context of the market trading near a key resistance area, is a bearish indication. This could be a crucial point in deciding whether to buy or sell NZDCHF.
If the weakness in NZDCHF continues and the minor support level gets broken, we might see a move down to the next Fibonacci cluster (0.5374 – 0.5400) and then possibly to 0.5322 on extension.
If NZDCHF ends up rallying above Friday’s high (0.5511), the market could move to 0.5577. This would necessitate an updated NZDCHF prediction.
Oscillator and Moving Averages
The Stochastic Oscillator has given a sell signal yesterday, which is noteworthy NZDCHF news, but at the same time, the SMA (20) has crossed above the SMA (50). Both the moving averages are now pointing higher, but this is mainly due to the strong rally seen in the market over the previous weeks.
This is yet another reminder of how the market swings determine the moves in the oscillators and moving averages. Therefore, they can act as highlighters, but the real market signals come from the NZDCHF price action itself.
Current Sentiment and Future Analysis
Given these dynamics, the current NZDCHF sentiment is mixed. Traders should closely monitor future NZDCHF technical analysis today and in the coming weeks to make informed decisions.
NZD and CHF currency strength analysis
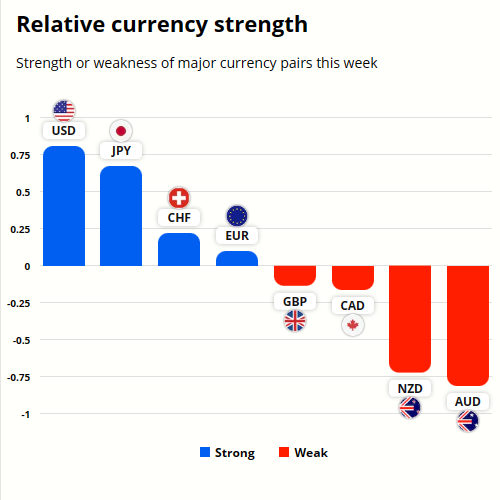
NZD is the second weakest currency while the CHF has been much stronger than NZD this week. USD is the strongest and the AUD the weakest currency.
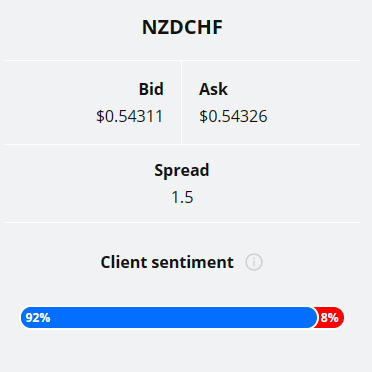
Almost all (92%) of the TIOmarkets' clients are long the NZDCHF currency pair. Only 8% are holding short positions in the market.
Please remember that the retail trader client sentiment is a contrarian indicator as most of the retail traders are on average betting against the market trends. This is why, experienced traders tend to trade against the retail client sentiment. You can follow the TIOmarkets client sentiment live on our Forex dashboard.
Fundamental NZDCHF analysis
Both New Zealand and Switzerland are contending with inflation, albeit at different magnitudes. New Zealand's inflation expectations have moderated slightly to 4.95%, but remain elevated, necessitating the Reserve Bank of New Zealand (RBNZ) to sustain an official cash rate (OCR) of 5.5%.
Conversely, Switzerland's annual inflation rate increased to 1.7% in September 2023, falling short of market expectations of 1.8%. The Swiss National Bank (SNB) has maintained its benchmark policy rate at 1.75%, adopting a cautious approach.
The RBNZ has enacted a series of rate hikes amounting to 525 basis points since October 2021, while the SNB has opted for stability in its rates.
Business Outlook and Trade Dynamics
New Zealand's ANZ Business Outlook Index has turned positive for the first time since May 2021. However, several activity indicators such as export and employment intentions have declined.
The trade deficit has narrowed, but exports, especially to key markets like China and Australia, have decreased. In Switzerland, modest GDP growth and a resilient employment market are counterbalanced by vulnerabilities in investment and the services sector.
The country's external position remains strong, with a current account surplus expanding to CHF 20 billion in Q2 2023.
Manufacturing and Employment Trends
New Zealand's manufacturing sector has contracted for the sixth consecutive month, primarily due to declines in new orders and production. Employment has slightly increased, but the overall sentiment is one of market uncertainty.
In contrast, Switzerland has experienced a resilient non-farm payroll growth of 2.2% year-on-year. However, youth unemployment is also at 2.2%, indicating an uneven distribution of employment opportunities.
Consumer Price Index and Food Inflation
New Zealand has seen a deceleration in food inflation, which eased to 8.9% in August 2023 from 9.6% in the previous month. In Switzerland, the Consumer Price Index (CPI) data revealed a monthly contraction, and core inflation slowed to 1.3% from 1.5%. These trends suggest that consumer behaviour in both countries may be influenced by inflationary pressures.
Monetary Policy Outlook
Both New Zealand and Switzerland are exercising caution in their monetary policies. The RBNZ has put rate hikes on hold and is vigilantly monitoring inflation and other economic indicators. The SNB, encouraged by the latest CPI data, is likely to continue its 'wait and see' approach, focusing on future inflation data and other economic indicators.
Summary and Implications
New Zealand and Switzerland offer contrasting economic scenarios. While New Zealand grapples with higher inflation and has employed a more assertive monetary policy, Switzerland has been more reserved in its monetary adjustments.
Both economies exhibit mixed indicators in areas such as trade, manufacturing, and employment. This suggests that targeted policies may be necessary to address specific vulnerabilities.
The prudent monetary stances adopted by both central banks underscore the intricacies embedded in their respective economic conditions. Future policy adjustments are expected to be made with a high degree of caution and scrutiny.

The next main risk events
- USD - JOLTS Job Openings
- NZD - Official Cash Rate
- NZD - RBNZ Rate Statement
- EUR - ECB President Lagarde Speaks
- USOIL - OPEC-JMMC Meetings
- USD - ADP Non-Farm Employment Change
- USD - ISM Services PMI
- EUR - ECB President Lagarde Speaks
- GBP - Construction PMI
- USD - Unemployment Claims
- CAD - Ivey PMI
- CHF - Foreign Currency Reserves
- CAD - Employment Change
- CAD - Unemployment Rate
- USD - Average Hourly Earnings m/m
- USD - Non-Farm Employment Change
- USD - Unemployment Rate
- USD - FOMC Member Waller Speaks
For more information and details see the TIOmarkets economic calendar.
While research has been undertaken to compile the above content, it remains an informational and educational piece only. None of the content provided constitutes any form of investment advice.
Tio Markets UK Limited is a company registered in England and Wales under company number 06592025 and is authorised and regulated by the Financial Conduct Authority FRN: 488900
Risk warning: CFDs are complex instruments and come with a high risk of losing money rapidly due to leverage. 82% of retail investor accounts lose money when trading CFDs with this provider. You should consider whether you understand how CFDs work and whether you can afford to take the high risk of losing your money. Professional clients can lose more than they deposit. All trading involves risk.
DISCLAIMER: Tio Markets offers an exclusively execution-only service. The views expressed are for information purposes only. None of the content provided constitutes any form of investment advice. The comments are made available purely for educational and marketing purposes and do NOT constitute advice or investment recommendation (and should not be considered as such) and do not in any way constitute an invitation to acquire any financial instrument or product. TIOmarkets and its affiliates and consultants are not liable for any damages that may be caused by individual comments or statements by TIOmarkets analysis and assumes no liability with respect to the completeness and correctness of the content presented. The investor is solely responsible for the risk of his/her investment decisions. The analyses and comments presented do not include any consideration of your personal investment objectives, financial circumstances, or needs. The content has not been prepared in accordance with any legal requirements for financial analysis and must, therefore, be viewed by the reader as marketing information. TIOmarkets prohibits duplication or publication without explicit approval.

Janne Muta holds an M.Sc in finance and has over 20 years experience in analysing and trading the financial markets.
