Risk disclaimer: 76% of retail investor accounts lose money when trading CFDs and Spreadbets with this provider. You should consider whether you understand how CFDs and Spreadbets work and whether you can afford to take the high risk of losing your money.
GBPUSD Technical Analysis | Bearish reversal underway?
BY Janne Muta
|January 5, 2024GBPUSD Technical Analysis - GBPUSD is showing signs of weakness as currency markets moderate their reaction to expectations of Fed rate cuts. The US Treasury Bond market has been selling off lately, sending yields higher. This trend has supported the USD and put pressure on risky assets. Today’s US job market report is likely to impact GBPUSD, at least intraday.
Therefore, we will examine employment trends as revealed by the recent employment data and provide you with a GBPUSD technical analysis.
The recent shifts in the US labour market, characterized by a cooling trend, are indicating a more tempered pace of economic growth. This change is evident from the reduction in job openings, a sign of a less heated job market. Despite this, the resilience in job creation underscores a still robust demand for labour, a complex scenario for monetary policymakers.
The moderation in wage growth is particularly significant. This trend is likely easing inflationary pressures, a critical concern for the Federal Reserve. With inflation being a key driver of monetary policy, a stable wage-growth environment could lead the Fed to consider a less aggressive stance on interest rate hikes, a move away from the hawkish policies seen in previous periods.
Such a shift in Fed policy, focusing on nurturing economic growth while keeping a watchful eye on inflation, could have implications for the US dollar. A less hawkish Fed might lead to a softer dollar, as aggressive rate hikes tend to bolster a currency's value. This potential softening of the dollar, in response to employment trends and the Fed's policy response, is a crucial element to consider in the context of GBPUSD currency pair analysis.
Summary of This GBPUSD Technical Analysis Report:
- Last week's bearish rejection candle suggests a downward market trend for GBPUSD. A close below 1.2684 would confirm a bearish reversal, targeting 1.2560 and potentially 1.2480. Conversely, a move to 1.2780 could lead to retesting the December High at 1.2828. Mixed signals from moving averages and a declining stochastic oscillator indicate waning momentum.
- GBPUSD broke out of a bullish trend and formed a bearish rejection candle. A failed rally at 1.2730 and further decline today hints at retesting the 1.2614 support. Breaching this could lead to 1.2502. Alternatively, surpassing 1.2730 resistance may trigger a continuation to 1.2780, aligning with the weekly analysis.
- The 4-hour chart shows GBPUSD forming a lower high at 1.2695, indicating a potential test of the 1.2614 support. Resistance near 1.2730 could limit buying interest above 1.2695. A decisive rally beyond 1.2730 would challenge the bearish outlook suggested in the weekly and daily analyses.
Read the full GBPUSD technical analysis report below.
GBPUSD technical analysis
Weekly GBPUSD technical analysis
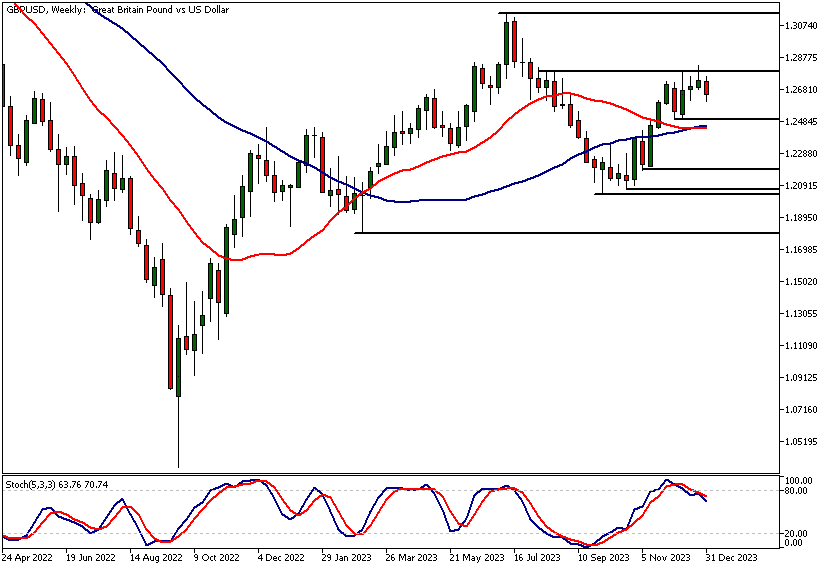
The market has moved lower after creating a bearish rejection candle last week. If GBPUSD closes below 1.2684, we'll have confirmation of a bearish market reversal, potentially seeing the market trade down to 1.2560 initially, and then perhaps 1.2480 on extension. Alternatively, a move to 1.2780 might take place, followed possibly by a retest of the December High at 1.2828.
GBPUSD technical analysis, based on moving averages, provides us with mixed indications. The 50-period moving average is pointing higher, while the 20-period is crossing below it. The stochastic oscillator is pointing lower, indicating that the market is losing momentum.

Daily GBPUSD technical analysis
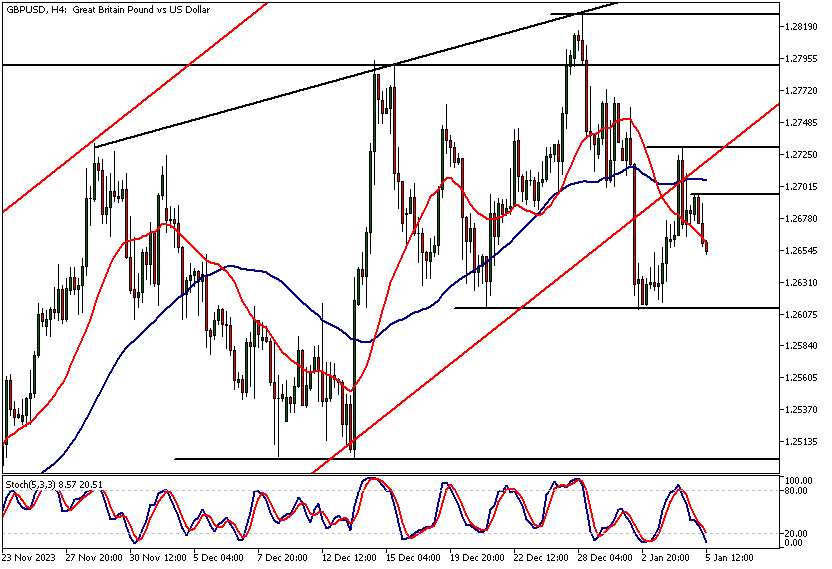
The market has broken out of a bullish trend channel and created a bearish rejection candle on the daily chart. Yesterday, the market attempted to rally but failed at 1.2730, and today the cable has lost further ground, potentially retesting the 1.2614 support level soon.
If this level doesn't hold, the lower reactionary high at 1.2730 indicates further downside potential for GBPUSD. In this scenario, the next support level at 1.2502 could come into play.
Alternatively, if the market rallies decisively above the 1.2730 resistance level, we might see a continuation move to the 1.2780 level, as referred to in the weekly GBPUSD technical analysis.
Intraday GBPUSD technical analysis
The 4-hour chart shows the market creating a lower reactionary high at 1.2695, another indication that the market is likely to trade lower and possibly test the 1.2614 support level soon.
The next resistance level above 1.2695 is relatively close at 1.2730, potentially making it difficult for the market to attract new buying above 1.2695. However, if there is a decisive rally above 1.2730, then the scenarios laid out in the weekly and daily GBPUSD technical analysis sections might become irrelevant.
Client sentiment analysis
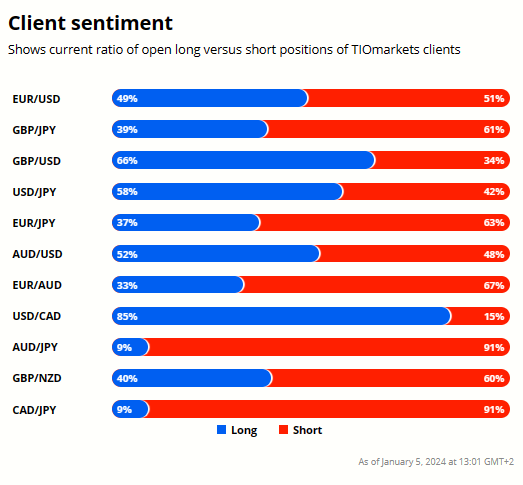
66% of clients trading GBPUSD are holding long positions, while 34% are holding short positions. Client sentiment data is being provided by TIO Markets Ltd.
It’s good to remember that retail client trading sentiment is a contrarian indicator as most retail traders are on average trading against market price trends. This is why experienced traders tend to trade against the retail client sentiment.You can follow the TIOmarkets client sentiment live on our Forex dashboard.
The next key risk events impacting this market
- Average Hourly Earnings m/m
- Non-Farm Employment Change
- Unemployment Rate
- ISM Services PMI
- FOMC Member Barkin Speaks
Potential GBPUSD Market Moves
A bearish outlook involves breaking below key supports at 1.2684 and 1.2614, targeting lower levels such as 1.2560 or perhaps even 1.2480 on extension. Conversely, a bullish scenario sees GBPUSD breaking above the 1.2730 resistance, potentially leading to a retest of higher levels like 1.2780 or the December high.

How Would You Trade GBPUSD Today?
I hope this GBPUSD technical analysis helps you to make better informed trading decisions. Check the latest market analysis for other instruments and subscribe to receive them in your inbox as soon as they are published
While research has been undertaken to compile the above content, it remains an informational and educational piece only. None of the content provided constitutes any form of investment advice.
TIO Markets UK Limited is a company registered in England and Wales under company number 06592025 and is authorised and regulated by the Financial Conduct Authority FRN: 488900
Risk warning: CFDs are complex instruments and come with a high risk of losing money rapidly due to leverage. 73% of retail investor accounts lose money when trading CFDs with this provider. You should consider whether you understand how CFDs work and whether you can afford to take the high risk of losing your money. Professional clients can lose more than they deposit. All trading involves risk.
DISCLAIMER: TIO Markets offers an exclusively execution-only service. The views expressed are for information purposes only. None of the content provided constitutes any form of investment advice. The comments are made available purely for educational and marketing purposes and do NOT constitute advice or investment recommendation (and should not be considered as such) and do not in any way constitute an invitation to acquire any financial instrument or product. TIOmarkets and its affiliates and consultants are not liable for any damages that may be caused by individual comments or statements by TIOmarkets analysis and assumes no liability with respect to the completeness and correctness of the content presented. The investor is solely responsible for the risk of his/her investment decisions. The analyses and comments presented do not include any consideration of your personal investment objectives, financial circumstances, or needs. The content has not been prepared in accordance with any legal requirements for financial analysis and must, therefore, be viewed by the reader as marketing information. TIOmarkets prohibits duplication or publication without explicit approval.

Janne Muta holds an M.Sc in finance and has over 20 years experience in analysing and trading the financial markets.
