Risk disclaimer: 76% of retail investor accounts lose money when trading CFDs and Spreadbets with this provider. You should consider whether you understand how CFDs and Spreadbets work and whether you can afford to take the high risk of losing your money.
GBPJPY technical analysis | Can GBPJPY break above a pivotal price level at 182.97?
BY Janne Muta
|October 11, 2023GBPJPY Technical Analysis: Our multi-timeframe analysis identifies key technical factors that could significantly impact market sentiment and the near-term price action in the GBPJPY currency pair. Weekly analysis indicates a bullish sentiment with a substantial YTD rally of over 17%.
Higher Swing Low
The market has just recently created higher swing low at 178.21 indicating further strength in the market. However, the market also faces a critical resistance at 182.97. If the level is breached decisively, the market might move towards 186.65. The bullish narrative is supported by ascending 20 and 50-period moving averages and a positive stochastic oscillator signal.
Daily Technical Analysis Overview
Equally, daily analysis unveils a technical confluence area between 183.01 - 183.36, acting as a strong resistance over the last fortnight, with moving averages showcasing a bearish order. The stochastic oscillator being in the overbought territory suggests caution for bulls.
4-Hour Technical Analysis Overview
Lastly, the 4-hour chart highlights a price channel with a bullish undertone. Nevertheless, nearing a significant resistance area could attract sellers. A correction to 182.32 may lure buyers, but a break below could see a further drop to 181.60.
The next key risk events for GBPJPY are
- UK GDP
- UK Unemployment Rate
- UK Inflation Rate
- Japan Balance of Trade
- Japan Inflation Rate
Read the full GBPJPY technical analysis report below
GBPJPY technical analysis
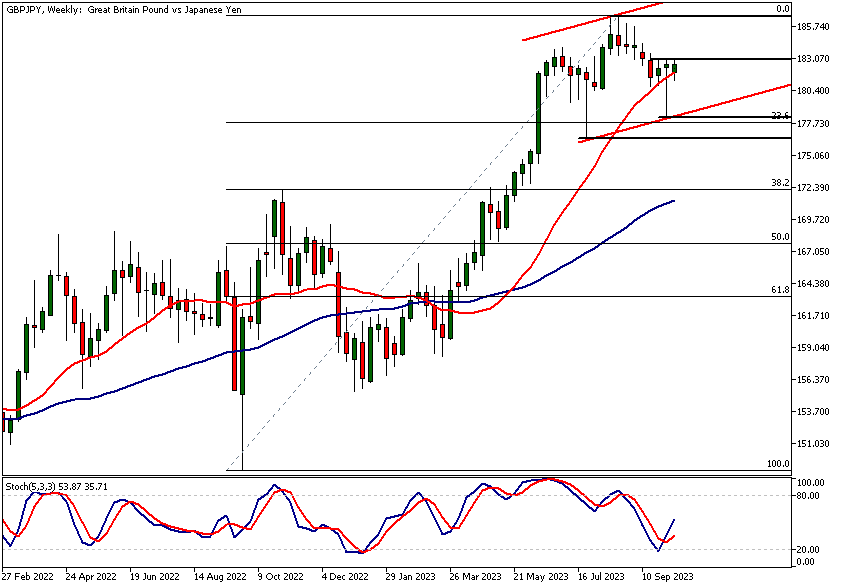
Weekly GBPJPY technical analysis
The market has rallied over 17% since the January low, and based on our GBPJPY technical analysis, there could be more upside ahead. The market has created a higher reactionary low at 178.21 and has rallied substantially (2.72%) in just two weeks.
Key Resistance Level and Potential Breakout
GBPJPY now trades near to a key resistance level at 182.97. This level obviously needs to be penetrated, and the market must sustain levels above it for the uptrend to remain strong. The higher swing low at 178.21 suggests that this breakout could take place.
Breakout Implications and Target Levels
A successful breakout above this level could move the market higher to 186.65. Based on our GBPJPY technical analysis, this price level might be targeted by swing traders in the case of the market breaking above the pivotal price level at 182.97. If the GBP bulls target the 186.65, it could create supply in GBP JPY around the price level.
Moving Averages and Market Signals
Both 20 and 50-period moving averages are pointing higher and they are in a bullish order; the 20-period is well above the 50-period, signalling strength in this market. At the same time, the stochastic oscillator has just recently given a buy signal.
Current Technical Analysis and Market Sentiment
Therefore, our GBPJPY technical analysis today indicates that the market sentiment is bullish. However, if the market cannot break above the key resistance level at 182.97, we could see it testing the nearest key support level at the 178.21 swing low. Its significance is highlighted by the fact that it is closely aligned with the 23.6% Fibonacci retracement level. If the market trades below the 178.21 support level, we might see the 176.31 support level being tested.

Daily GBPJPY technical analysis
The daily timeframe GBPJPY technical analysis reveals the market trading near a technical confluence area (183.01 - 183.36). This pivotal price area has turned the price lower over the last two weeks and acted as support in August and September.
Moving Averages within the Confluence Area
The 50-period moving average is also inside this technical confluence area. Clearly, the area has psychological significance, and whether the market can penetrate the area or not is likely to impact the market sentiment and future price action substantially.
Bearish Order of Moving Averages and Stochastic Oscillator
The 20 and 50-period moving averages are in a bearish order, with the fast moving average below the slow, and the 50-period moving average points sideways. At the same time, the stochastic oscillator is in the overbought area.
Market Conditions and Trader Caution
With the market overbought in terms of the stochastic oscillator and trading at a key resistance area, the bulls should be careful and pay close attention to GBPJPY technical analysis in intraday time frames. If price action in the lower time frames does not support a bullish view, then traders should either stay in cash or look for opportunities to enter short trades.
Recent Market Strength and Potential Upside
However, the market has been quite strong lately. The rally from the most recent swing low has been almost 3%, suggesting strong bullish sentiment in this market. Therefore, it would not be a surprise to see the market trading higher and penetrating the resistance area successfully. This could result in traders targeting the 186.65 price level.
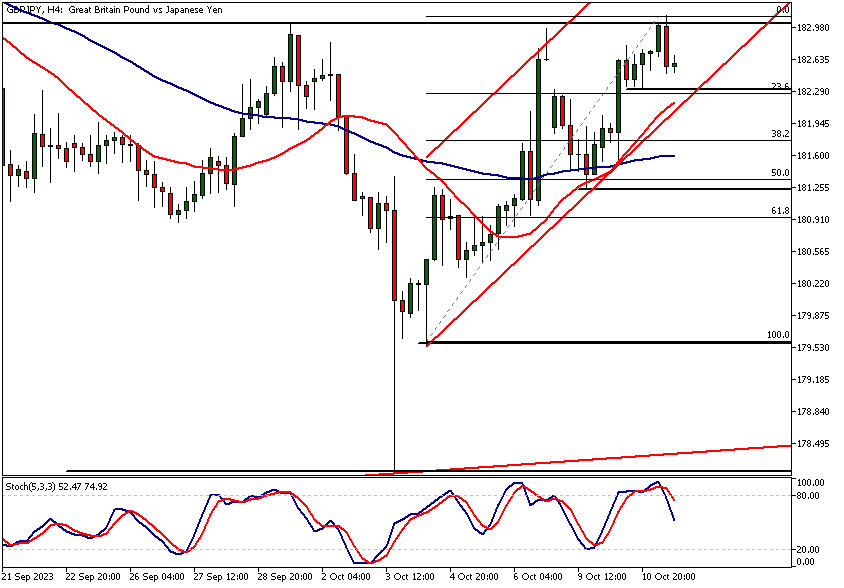
GBPJPY technical analysis, 4h
In the 4-hour chart, the market is trending higher in a price channel. GBPJPY has created higher lows and the moving averages are in a bullish order, with the fast moving average above the slow. However, as noted in the daily and weekly GBP JPY technical analysis above, the market is trading close to a significant resistance area.
Potential Market Reaction at Pivotal Price Area
This pivotal price area, just above the current market price, has attracted sellers and softened the bids in GBP JPY. Such weakness, our GBPJPY technical analysis indicates, could bring the nearest 4-hour support level at 182.32 into play.
Support Level Alignment with Fibonacci Retracement
This price level is closely aligned with the 23.6% Fibonacci retracement level. Also, the ascending trend channel low and the SMA(20) are fairly close to this support level. Therefore, if the market corrects down to 182.32 level, we could see GBPJPY attracting buyers near this level. However, there is a decisive break below the level, we could see the market trading down to 181.60, where the 50-period moving average currently is.
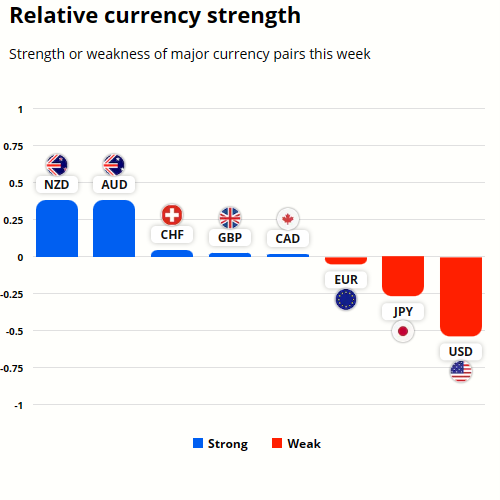
GBP and JPY Currency Strength Analysis
GBP is currently the third strongest currency and stronger than JPY that is the second weakest. NZD is the strongest and the USD the weakest.
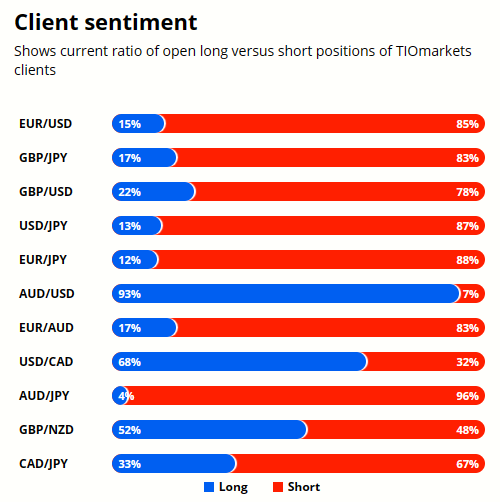
Client sentiment analysis
Almost 80% of retail traders are short the GBPJPY currency pair with only 22% holding long positions. Read our GBPJPY technical analysis report above to take advantage of the retail trader sentiment.
Please remember that the retail trader client sentiment is a contrarian indicator as most of the retail traders are on average betting against the market trends. This is why, experienced traders tend to trade against the retail client sentiment. You can follow the TIOmarkets client sentiment live on our Forex dashboard.
The key takeaways from this report
- GBPJPY weekly analysis reveals a bullish market sentiment with a substantial rally of over 17%, creating a higher reactionary low at 178.21, targeting resistance at 182.97, which if breached could lead to a new target at 186.65.
- Daily timeframe showcases a technical confluence area between 183.01 - 183.36 acting as strong resistance, with bearish order in moving averages, and an overbought stochastic oscillator suggesting caution for bulls.
- The 4-hour GBPJPY chart displays a bullish price channel, yet nearing a significant resistance area could attract sellers, with a potential correction to 182.32, aligning with the 23.6% Fibonacci retracement level.
- Bullish moving averages on the weekly chart signify market strength; however, the daily chart reveals a bearish order, indicating a possible shift in market sentiment if key resistance levels are not breached.
- The stochastic oscillator on the weekly chart signals a buy, contrasting the overbought scenario on the daily chart, highlighting varying market conditions across different timeframes.
- GBPJPY technical analysis across multiple timeframes provides a rich insight into potential market directions, with key price levels and technical indicators suggesting a complex interplay of bullish and bearish forces.
Read more analysis on GBP
Read more analysis on JPY
We hope that our GBPJPY technical analysis helps our readers to make better trading decisions!

The next main risk events
- USD - Core PPI m/m
- USD - PPI m/m
- USD - FOMC Member Waller Speaks
- USD - FOMC Meeting Minutes
- GBP - GDP m/m
- USD - Core CPI m/m
- USD - CPI m/m
- USD - CPI y/y
- USD - Unemployment Claims
- CNY - CPI y/y
- CNY - PPI y/y
- GBP - BOE Gov Bailey Speaks
- EUR - ECB President Lagarde Speaks
- USD - FOMC Member Harker Speaks
- USD - Prelim UoM Consumer Sentiment
- USD - Prelim UoM Inflation Expectations
- GBP - BOE Gov Bailey Speaks
- EUR - ECB President Lagarde Speaks
For more information and details see the TIOmarkets economic calendar.
While research has been undertaken to compile the above content, it remains an informational and educational piece only. None of the content provided constitutes any form of investment advice.
Tio Markets UK Limited is a company registered in England and Wales under company number 06592025 and is authorised and regulated by the Financial Conduct Authority FRN: 488900
Risk warning: CFDs are complex instruments and come with a high risk of losing money rapidly due to leverage. 82% of retail investor accounts lose money when trading CFDs with this provider. You should consider whether you understand how CFDs work and whether you can afford to take the high risk of losing your money. Professional clients can lose more than they deposit. All trading involves risk.
DISCLAIMER: Tio Markets offers an exclusively execution-only service. The views expressed are for information purposes only. None of the content provided constitutes any form of investment advice. The comments are made available purely for educational and marketing purposes and do NOT constitute advice or investment recommendation (and should not be considered as such) and do not in any way constitute an invitation to acquire any financial instrument or product. TIOmarkets and its affiliates and consultants are not liable for any damages that may be caused by individual comments or statements by TIOmarkets analysis and assumes no liability with respect to the completeness and correctness of the content presented. The investor is solely responsible for the risk of his/her investment decisions. The analyses and comments presented do not include any consideration of your personal investment objectives, financial circumstances, or needs. The content has not been prepared in accordance with any legal requirements for financial analysis and must, therefore, be viewed by the reader as marketing information. TIOmarkets prohibits duplication or publication without explicit approval.

Janne Muta holds an M.Sc in finance and has over 20 years experience in analysing and trading the financial markets.
