Risk disclaimer: 76% of retail investor accounts lose money when trading CFDs and Spreadbets with this provider. You should consider whether you understand how CFDs and Spreadbets work and whether you can afford to take the high risk of losing your money.
GBPCAD Analysis | Failure to penetrate 1.6761
BY Janne Muta
|October 20, 2023GBPCAD analysis reveals a promising 2.5% rally failing to break through a critical confluence zone in GBPCAD. This resulted in a double top in the daily chart and the formation of a resistance area between 1.6715 and 1.6761.
Technical Indicators and Market Potential
Technical indicators like the slow SMA(50) and the stochastic oscillator show some optimism, suggesting potential for recovery. However, for a substantial rally, the pair needs to surpass the above-mentioned resistance zone, which, if successful, could lead to a rally to 1.6910. Failure to do so may result in a re-test of the earlier low at 1.6357.
Bearish Momentum and Signs of Possible Reversal
In addition, GBPCAD analysis of SMA trends in the daily timeframe chart indicates bearish momentum. Although the SMA(20) is converging towards the SMA(50), hinting at a possible reversal. Price action suggests a double top formation, indicating supply levels that need to be cleared for upward movement.
Impact of Economic Data on Market Sentiment
Economic data releases, such as upcoming Canada retail sales data today, could also influence market sentiment as it is the last data release before the BoC meeting next week. Retail sales are expected to come in at -0.1% (1.0% prior). UK retail sales were released to day and saw a -0.9% drop (-0.3% expected, 0.4% previous). There was no substantial reaction in Sterling to the data release.
The next key risk events for GBPCAD are
- Canada Retail Sales (today)
- UK Flash Manufacturing and Services PMIs
- BoC Monetary Policy Report
Read the full GBPCAD technical analysis report below
GBPCAD analysis
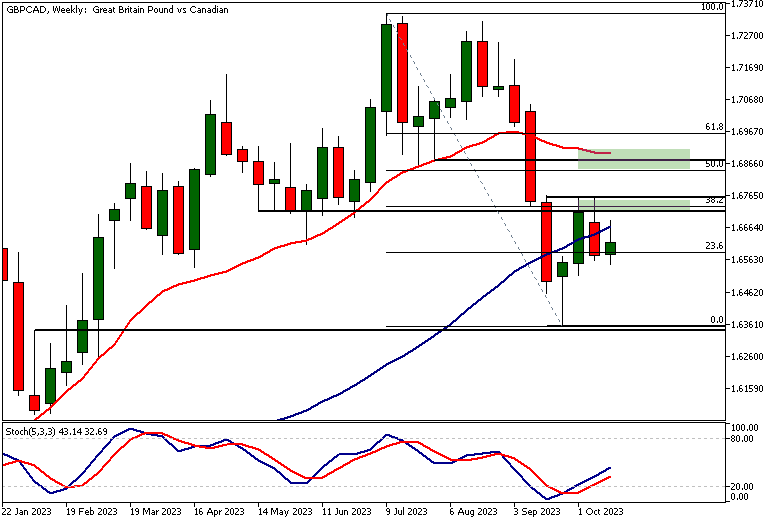
Weekly GBPCAD analysis
The market saw a promising 2.5% rally which unfortunately failed last week. The rally was halted as the market wasn’t able to penetrate a confluence zone. This zone was created by a market structure level and the 38.2% Fibonacci level, acting as a barrier to the advancing price action.
Resistance Formation
As a result, a resistance area has been now created at 1.6715 - 1.6761. This followed as GBPCAD retraced to a significant weekly pivotal candle high at 1.6575.
Technical Indicators
The technical indicators show signs of optimism. The slow SMA(50) is still pointing higher while the stochastic oscillator is moving higher from an oversold condition. These movements suggest a potential recovery in the market, hinting at underlying bullish tendencies that could propel GBPCAD higher.
Critical Resistance
However, for a substantial recovery, it's crucial that GBPCAD rallies decisively above the resistance area spanning 1.6715 - 1.6761. A successful break of this zone could potentially take the market to the next confluence zone between 1.6847 - 1.6910, marking new horizons for the bulls.
Market Scenarios
On the other hand, failure to rally above the 1.6715 - 1.6761 zone would indicate further weakness, possibly leading the market to re-test the earlier low at 1.6357. This scenario would create a new lower high in the market at 1.6761, thereby increasing the likelihood of the market either trending lower or consolidating further inside the 1.6357 - 1.6761 range.
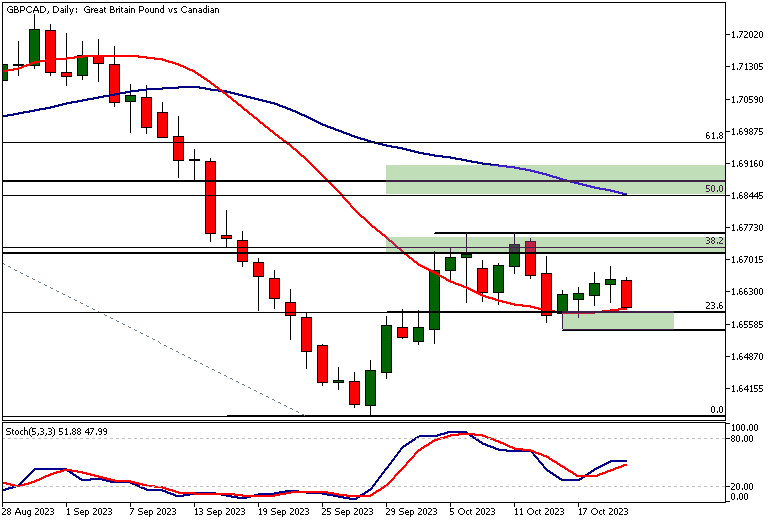
Daily GBPCAD analysis
In the daily chart, the SMAs are pointing lower and are in the bearish order. The SMA(20) is below the SMA(50). At the same time, the SMA(20) is converging (moving towards the slower SMA) reflecting the fact that the earlier strong down move is possibly reversing.
Interpretation of Indicator and Price Action
Please remember though that indicators follow the price, not the other way around. Institutional money flows in and out of the market dictate how the price moves. Therefore, price action is the best indicator available as it clearly reflects the changes in supply and demand.
GBPCAD Market Structure
Note, how GBPCAD has now created a double top inside the nearest confluence zone. This suggests that there is supply above 1.6761. If the supply isn't cleared, the market cannot move higher. The market, however, has also attracted buying after it moved to a daily market structure level at 1.6590.
Price Reaction at Key Market Levels
This level had some minor supply at the start of the month (October) but it was soon penetrated. Now the same area has had enough demand to stop the decline and attract new buying that has moved the price higher over the last four days. This level coincides with the SMA(20) and the 23.6% Fibonacci retracement level, which has added to its significance at least among those that employ indicator-based GBPCAD analysis.
Evaluation of Recent Price Rally
The rally since the 1.6548 has been quite weak though. This suggests a lack of substantial imbalance of supply and demand. Therefore, the risk of the market breaking below the 1.6548 low has increased. Perhaps the presence of a double top i.e. a failure to penetrate the 1.6761 level dampens the mood among the GBP bulls.
Anticipated Market Reaction
Another potential reason for the lack of enthusiasm among the buyers is the Canada retail sales data release due to later on today. In any case, should the market break the 1.6548 level, we should be prepared to see the market trading down to levels near the September low at 1.6357.
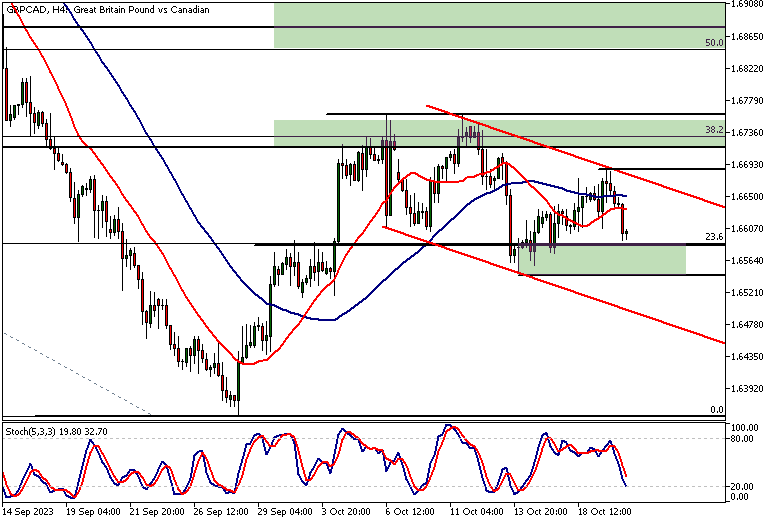
GBPCAD analysis, 4h
GBPCAD analysis in the four-hour chart reveals a bearish trend channel the market is trading in. The moving averages are in the bearish order, with the SMA(20) below the SMA(50). The indication is clearly bearish but in order for the market to continue lower it needs to be able to clear any potential demand below the 1.6548 level.
Potential Market Movement
The green box below the current market price highlights the confluence zone created by this swing low and the 23.6% Fibonacci level. If the market attracts buying inside this zone and we get a strong rally from the zone the likelihood of the market breaking out of the bearish channel is higher.
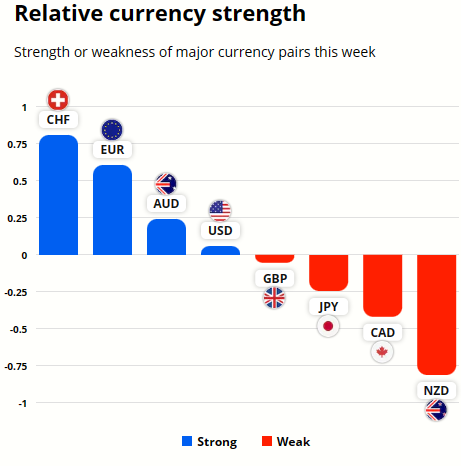
GBP and JPY Currency Strength Analysis
GBP is only slightly stronger than CAD while the CHF is the strongest currency and the NZD the weakest.

Client sentiment analysis
Majority of retail traders are bearish (78%) on GBPCAD currency pair. Only 22% are currently long the market. Use our GBPCAD analysis together with this retail sentiment indicator make better trading decisions.
Please remember that the retail trader client sentiment is a contrarian indicator as most of the retail traders are on average betting against the market trends. This is why, experienced traders tend to trade against the retail client sentiment. You can follow the TIOmarkets client sentiment live on our Forex dashboard.
The key takeaways from this report
- GBPCAD's recent 2.5% rally failed to break the resistance zone between 1.6715 and 1.6761. Technical indicators like the slow SMA(50) and stochastic oscillator suggest bullish tendencies. A successful break could lead to a rally to 1.6910; failure risks retesting 1.6357.
- The SMA trends in GBPCAD's daily chart indicate bearish momentum. However, SMA(20) is converging towards SMA(50), hinting at a potential reversal. A double top formation at 1.6761 is a key resistance level that needs to be cleared for upward movement.
- Economic data such as Canada's upcoming retail sales could influence GBPCAD. The last data release before the BoC meeting shows expected retail sales at -0.1%. A significant deviation from expectations could drive volatility and alter market sentiment.
- In the weekly GBPCAD analysis, the market failed to penetrate a confluence zone formed by a market structure level and the 38.2% Fibonacci level. The stochastic oscillator is moving higher from an oversold condition, indicating a potential market recovery.
- In the daily GBPCAD chart, a double top has formed inside a key confluence zone at 1.6761. This level aligns with the SMA(20) and the 23.6% Fibonacci retracement level, adding to its significance. A failure to clear this supply could lead to a market decline.
- On the 4-hour chart, GBPCAD shows a bearish trend within a channel. The SMA(20) is below the SMA(50), reinforcing the bearish outlook. A confluence zone created by a swing low and the 23.6% Fibonacci level could act as a potential demand area to break the bearish trend.
Read more analysis on GBP
Read more analysis on CAD
We hope that our GBPCAD technical analysis helps our readers to make better trading decisions!

The next main risk events
- Canada Retail Sales (today)
- UK Flash Manufacturing and Services PMIs
- BoC Monetary Policy Report
For more information and details see the TIOmarkets economic calendar.
While research has been undertaken to compile the above content, it remains an informational and educational piece only. None of the content provided constitutes any form of investment advice.
Tio Markets UK Limited is a company registered in England and Wales under company number 06592025 and is authorised and regulated by the Financial Conduct Authority FRN: 488900
Risk warning: CFDs are complex instruments and come with a high risk of losing money rapidly due to leverage. 82% of retail investor accounts lose money when trading CFDs with this provider. You should consider whether you understand how CFDs work and whether you can afford to take the high risk of losing your money. Professional clients can lose more than they deposit. All trading involves risk.
DISCLAIMER: Tio Markets offers an exclusively execution-only service. The views expressed are for information purposes only. None of the content provided constitutes any form of investment advice. The comments are made available purely for educational and marketing purposes and do NOT constitute advice or investment recommendation (and should not be considered as such) and do not in any way constitute an invitation to acquire any financial instrument or product. TIOmarkets and its affiliates and consultants are not liable for any damages that may be caused by individual comments or statements by TIOmarkets analysis and assumes no liability with respect to the completeness and correctness of the content presented. The investor is solely responsible for the risk of his/her investment decisions. The analyses and comments presented do not include any consideration of your personal investment objectives, financial circumstances, or needs. The content has not been prepared in accordance with any legal requirements for financial analysis and must, therefore, be viewed by the reader as marketing information. TIOmarkets prohibits duplication or publication without explicit approval.

Janne Muta holds an M.Sc in finance and has over 20 years experience in analysing and trading the financial markets.
