Risk disclaimer: 76% of retail investor accounts lose money when trading CFDs and Spreadbets with this provider. You should consider whether you understand how CFDs and Spreadbets work and whether you can afford to take the high risk of losing your money.
GBPAUD technical analysis | The market trades at a key support level
BY Janne Muta
|September 13, 2023Our GBPAUD technical analysis together with the very latest macroeconomic data in the subsequent economies provides a view of the potential future direction for the GBPAUD pair. On a technical level, the pair has retraced to a pivotal confluence zone between 1.9332 and 1.9392, underpinned by the 23.6% Fibonacci retracement level, a recent market structure, and the lower boundary of a bullish channel. The moving averages in both weekly and daily charts support a bullish outlook.
Contrasting economic landscapes
On the fundamental side, Australia's economy is experiencing moderate growth and persistent inflation. Meanwhile, the UK economy is confronting a challenging period marked by a contraction in economic growth, an uptick in unemployment, and wage-driven inflationary pressures.
The value of GBPAUD technical analysis
Due to these macroeconomic complexities, GBPAUD technical analysis is now highly valuable. Technical factors such as the current weekly and daily up trend, bullish moving averages, and oversold conditions on the Stochastic Oscillator point to a relatively high likelihood of the pair continuing its uptrend. However, we do also consider bearish scenarios as caution is advised due to underlying economic uncertainties.
Upcoming economic events impacting the GBPAUD
The next key risk events for this FX pair: Australian employment change tomorrow and monetary policy meeting minutes on Tuesday next week. The UK CPI and rate decision are due on Wednesday and Thursday next week. UK retail sales are due on Friday next week.
The key takeaways:
- GBPAUD has retraced to a critical technical confluence zone between 1.9332 and 1.9392. This zone is significant as it aligns with the 23.6% Fibonacci retracement level and a recent market structure. If bullish activity continues, expect a significant upward move. Failure to rally from this zone could lead to a reversal of the current uptrend, which has seen the pair rise by approximately 13.1% YTD.
- On both the weekly and daily charts, the GBPAUD technical analysis shows how moving averages suggest a bullish outlook. The fast SMA (20 periods) is currently at 1.9156 and is above the slow SMA (50 periods). These bullish moving averages provide potential support but if the pair moves below 1.9156, it may exit the bullish channel.
- The Stochastic Oscillator on the weekly chart is nearing levels where it previously reversed upwards, suggesting GBPAUD is close to oversold conditions. On the daily chart, the oscillator is below 20 but shows bullish divergence, which could act as a buy signal if the market rallies.
- In the daily timeframe GBPAUD technical analysis, GBPAUD is trading just above the SMA(50) and a former resistance level. A narrow range daily candle indicates potential indecisiveness, often acting as a reversal signal at support levels. Bullish continuation could lead to significant gains this week.
- The four-hour chart reveals an attempt to break out of a bearish trend channel. A market structure level at 1.9498 has pushed the pair lower, but if a higher low above 1.9381 is created, expect a bullish continuation to potentially 1.9637 and beyond. The Stochastics Oscillator suggests a momentum shift is underway.
GBPAUD technical analysis
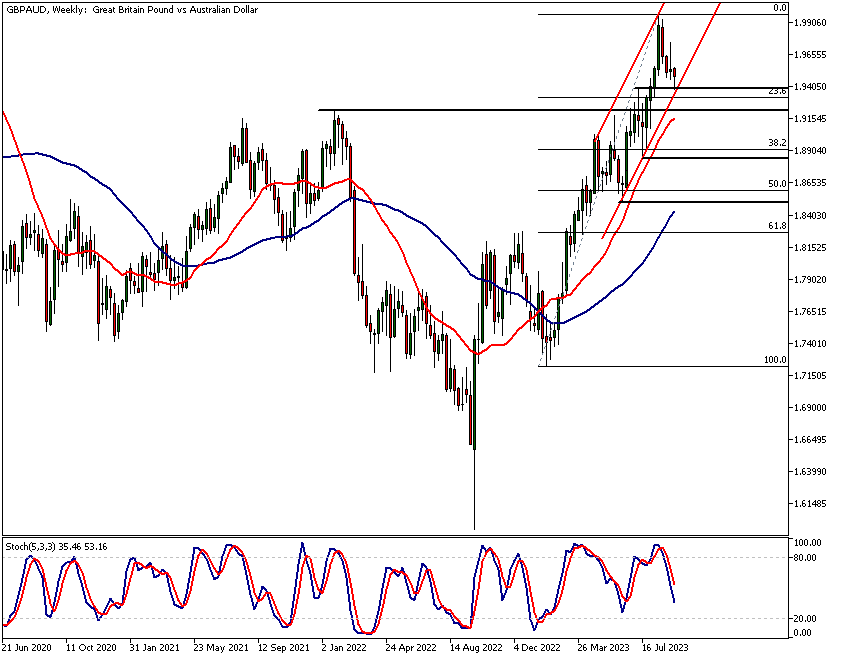
GBPAUD technical analysis, weekly chart
GBPAUD has retraced to a crucial area that serves as a confluence of multiple technical indicators: the bull channel low, a recent market structure level, and the 23.6% Fibonacci retracement level. This confluence creates a significant support area where the market has already shown a bullish reaction.
Scenarios: Bullish Continuation or Trend Reversal
Depending on market behaviour at this key technical juncture, two scenarios could unfold. If the bullish reaction persists, a significant upward movement may occur over the next couple of days. Conversely, a failure to rally from this support could indicate a trend reversal, especially notable given that GBPAUD has gained approximately 13.1% year-to-date.
Moving Averages: Bullish but with Caveats
The Simple Moving Averages (SMAs) are still aligned in a bullish configuration, with the fast SMA (20 periods) situated above the slow SMA (50 periods). However, the fast SMA is approaching the bull channel low and is near a market structure level established in January 2022, which could serve as a potential support area. A move to this zone would mean the market exits the bullish trend channel, thereby weakening the bullish case.
Stochastic Oscillator: Approaching Oversold Territory
The Stochastic Oscillator is nearing levels where it previously reversed and turned higher, specifically in June. Coupled with the market's proximity to the bull channel low and a recent market structure level, this suggests that GBPAUD is nearing oversold conditions.
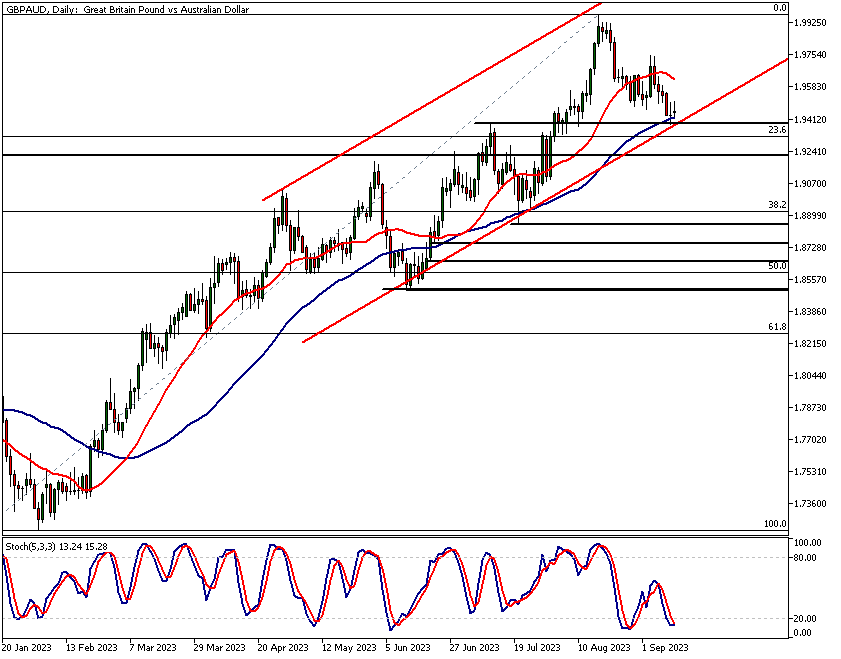
GBPAUD technical analysis, daily chart
On the daily chart, GBPAUD is trading just above its 50-period Simple Moving Average (SMA) and a level that previously served as resistance. These factors, coupled with the bull channel low, acted as magnets for buyers yesterday. The day closed with a narrow range candle, commonly interpreted as a sign of market indecisiveness.
Significance of Narrow Range Candles
In the context of support levels, narrow range candles often serve as reversal indicators. Therefore, the appearance of such a candle suggests that bulls found the current price levels technically significant for entering long positions. This makes today's price action pivotal: should bullish momentum continue, we could witness a substantial upward move for the week.
Moving Averages: Ongoing Bullish Alignment
In the daily chart, the SMAs are also in a bullish sequence, with the SMA(20) situated above the SMA(50). Though there is slight convergence between the two averages, the bullish sentiment remains relatively robust.
Stochastic Oscillator: Bullish Divergence and Potential Buy Signals
As of writing, the Stochastic Oscillator is below 20, indicating potential oversold conditions. Furthermore, it shows bullish divergence, although a clear buy signal has not yet been triggered. Should the market rally from its current position, the oscillator is likely to cross above its signal line and the 20-level, which traders relying on technical indicators would typically interpret as buy signals.
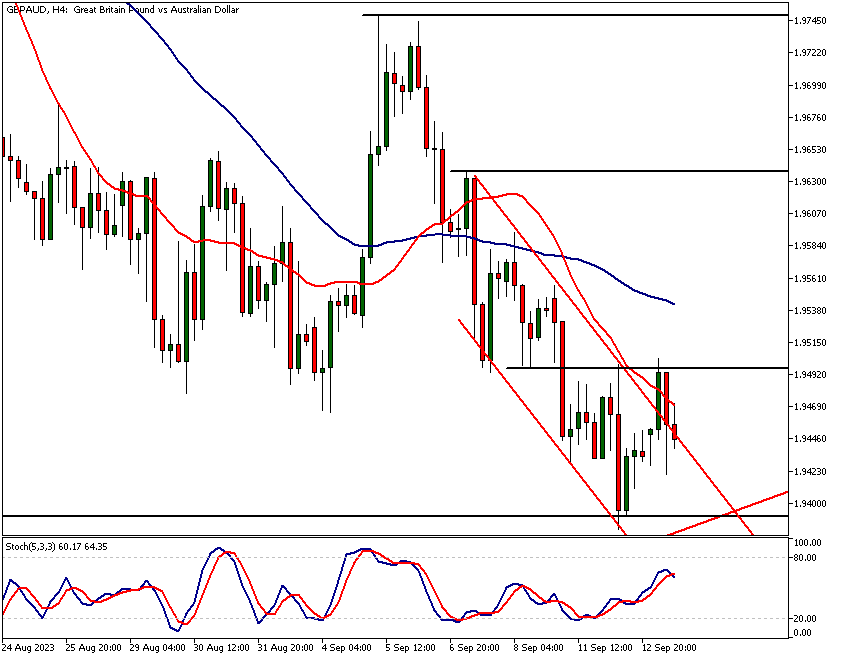
GBPAUD technical analysis, 4h chart
The four-hour GBPAUD technical analysis reveals an attempt to breakout of a bearish 4h trend channel. A market structure level at 1.9498 pushed the market lower again but if GBPAUD can create a higher reactionary low above 1.9381 we have reason to believe that the bullish reaction to the daily confluence area (see the analysis above) is still in ongoing.
This could take the market to 1.9637 and then possibly to 1.9748 and beyond.
The moving averages are still in a bearish order but the Stochastics Oscillator points higher suggesting a shift in momentum has already started. If this potential momentum reversal fails look for a move below yesterday’s low (1.9381). If yesterday’s low is broken decisively, the following move could take the market to 1.9156.
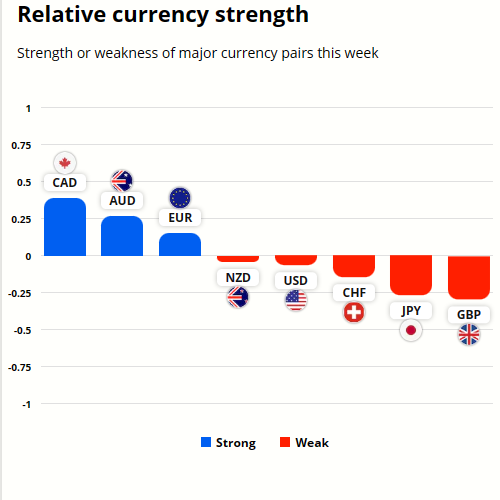
GBP and AUD currency strength analysis
Sterling (GBP) is the weakest in the comparison group while the AUD is the second strongest. Only CAD is performing better than the AUD. To better understand the future price swings in these currencies refer to the GBPAUD technical analysis in this report.
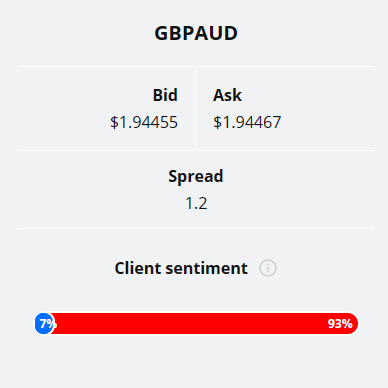
93% of TIOmarkets' clients are bearish on the GBPAUD currency pair. Read our technical and fundamental analysis to verify how appropriate such extreme positioning is in this FX pair.
Please remember that the retail trader client sentiment is a contrarian indicator as most of the retail traders are on average betting against the market trends. This is why, experienced traders tend to trade against the retail client sentiment. You can follow the TIOmarkets client sentiment live on our Forex dashboard.
GBPAUD fundamental analysis
Australia has been experiencing a consistent economic expansion, propelled in part by public investment in sectors such as health, transport, and defence. However, inflation remains a significant concern, influencing the Reserve Bank of Australia's monetary policy.
Monetary Policy and Labour Market Outlook
The RBA's cash rate stands at 4.1%, and there are indications of future monetary tightening. High interest rates have subdued household consumption, and unemployment is expected to rise due to economic and sectoral factors.
UK's Economic Landscape: Contraction and Wage Inflation
The UK economy is in a contracting phase, marked by a decline in GDP and a slight increase in unemployment. However, the rise in wages, especially in the public sector, adds another layer of complexity to the situation.
The wage growth in the UK poses challenges for the Bank of England's anti-inflationary policies. While a narrowing trade deficit might offer some relief, contractions in key sectors could impact inflationary pressures differently.
Balancing Growth, Inflation, and Unemployment
Both Australia and the UK are facing the intricate task of managing growth, inflation, and employment simultaneously. The divergent economic scenarios make technical analysis of the GBPAUD pair particularly relevant for understanding market sentiment.
The key findings of the GBPAUD technical analysis:
- GBPAUD has retraced to a critical confluence zone between 1.9332 and 1.9392. This zone is significant as it aligns with the 23.6% Fibonacci retracement level and a recent market structure. If bullish activity continues, expect a significant upward move. Failure to rally from this zone could lead to a reversal of the current uptrend, which has seen the pair rise by approximately 13.1% YTD.
- On both the weekly and daily charts, the GBPAUD technical analysis shows how moving averages suggest a bullish outlook. The fast SMA (20 periods) is currently at 1.9156 and is above the slow SMA (50 periods). These bullish moving averages provide potential support but if the pair moves below 1.9156, it may exit the bullish channel.
- The Stochastic Oscillator on the weekly chart is nearing levels where it previously reversed upwards, suggesting GBPAUD is close to oversold conditions. On the daily chart, the oscillator is below 20 but shows bullish divergence, which could act as a buy signal if the market rallies.
- In the daily chart, GBPAUD trades right above the SMA(50) and a level that used to act as a resistance. This market structure level together with the SMA and the bull channel low attracted buyers into this FX pair yesterday. The daily candle was a narrow range candle that often signals indecisiveness. At support levels these candles are known to act as reversal signals.
- The four-hour GBPAUD technical analysis reveals an attempt to breakout of a bearish 4h trend channel. A market structure level at 1.9498 pushed the market lower again but if GBPAUD can create a higher reactionary low above 1.9381 we have reason to believe that the bullish reaction to the daily confluence area is still in ongoing. This could take the market to 1.9637 and then possibly to 1.9748 and beyond.
- The Australian economy is characterized by moderate growth but tempered by inflationary pressures and below-trend expansion. The UK economy is grappling with the challenges of inflation and subdued growth, while demonstrating resilience and moderate optimism in specific sectors.

The next main risk events
- USD - Core CPI
- USD - CPI
- AUD - Employment Change
- AUD - Unemployment Rate
- EUR - Main Refinancing Rate
- EUR - Monetary Policy Statement
- USD - Core PPI
- USD - Core Retail Sales
- USD - PPI
- USD - Retail Sales
- USD - Unemployment Claims
- EUR - ECB Press Conference
- CNY - Industrial Production
- CNY - Retail Sales
- USD - Empire State Manufacturing Index
- USD - Industrial Production
- USD - Prelim UoM Consumer Sentiment
- USD - Prelim UoM Inflation Expectations
For more information and details see the TIOmarkets economic calendar.
While research has been undertaken to compile the above content, it remains an informational and educational piece only. None of the content provided constitutes any form of investment advice.
Tio Markets UK Limited is a company registered in England and Wales under company number 06592025 and is authorised and regulated by the Financial Conduct Authority FRN: 488900
Risk warning: CFDs are complex instruments and come with a high risk of losing money rapidly due to leverage. 82% of retail investor accounts lose money when trading CFDs with this provider. You should consider whether you understand how CFDs work and whether you can afford to take the high risk of losing your money. Professional clients can lose more than they deposit. All trading involves risk.
DISCLAIMER: Tio Markets offers an exclusively execution-only service. The views expressed are for information purposes only. None of the content provided constitutes any form of investment advice. The comments are made available purely for educational and marketing purposes and do NOT constitute advice or investment recommendation (and should not be considered as such) and do not in any way constitute an invitation to acquire any financial instrument or product. TIOmarkets and its affiliates and consultants are not liable for any damages that may be caused by individual comments or statements by TIOmarkets analysis and assumes no liability with respect to the completeness and correctness of the content presented. The investor is solely responsible for the risk of his/her investment decisions. The analyses and comments presented do not include any consideration of your personal investment objectives, financial circumstances, or needs. The content has not been prepared in accordance with any legal requirements for financial analysis and must, therefore, be viewed by the reader as marketing information. TIOmarkets prohibits duplication or publication without explicit approval.

Janne Muta holds an M.Sc in finance and has over 20 years experience in analysing and trading the financial markets.
