Risk disclaimer: 76% of retail investor accounts lose money when trading CFDs and Spreadbets with this provider. You should consider whether you understand how CFDs and Spreadbets work and whether you can afford to take the high risk of losing your money.
FTSE 100 Technical Analysis | Key Growth Factors for UK Equities
BY Janne Muta
|December 11, 2023FTSE 100 technical analysis - FTSE has gained over 4% since the October low as the moderation of annual inflation from 6.7% to 4.6% has alleviated some cost pressures on businesses and consumers, potentially leading to increased profitability and spending. Below, we will examine the factors contributing to an environment conducive to growth for FTSE 100 companies.
Positive UK economic data has had a favourable impact on the FTSE 100 in recent weeks. The gradual improvement in the manufacturing sector, as evidenced by the rise in the S&P Global/CIPS Manufacturing PMI to 44.8 in October 2023, signals a slow but steady recovery in industrial activity, a crucial driver of economic growth. This improvement is likely to boost investor confidence in the industrial and related sectors.
Furthermore, the increase in consumer confidence, reflected in the growth of new car sales and the GfK Consumer Confidence Index, suggests a revival in consumer spending. This has helped consumer-driven stocks in the FTSE 100 outperform the index since November 1st. The stable labour market, with an unchanged unemployment rate and a significant uptick in employment, underpins consumer spending and economic stability.
Furthermore, the Bank of England's decision to maintain interest rates at 5.25% in November 2023 has indeed created a stable financial environment, which is crucial for business planning and investment. The BoE is anticipated to keep rates unchanged in this week's meeting and is projected to start rate cuts in June 2024. Consequently, investors have been discounting future cash flow values in anticipation of a lower interest rate environment and have been investing in stocks.
Summary of This FTSE 100 Technical Analysis Report:
- The market has been moving slowly higher, with only one down week since it started attracting buyers at the end of October. Gains have been quite modest compared to the DAX, the other major European equity index. Nonetheless, the FTSE 100 has provided plenty of opportunities to participate on the long side and has been able to push higher by over 4% since the October low.
- The FTSE rally on Friday was thwarted at a market structure level (7582) that had previously supported FTSE in mid-October. However, the market remains in an uptrend as it continues to create higher lows and higher highs.
- The market is in an uptrend, which suggests that traders (and investors) might be looking to buy the dips. The nearest 8-hour support levels are 7458, 7474, and 7507.
Read the full FTSE 100 technical analysis report below.
FTSE 100 technical analysis

Weekly FTSE 100 technical analysis
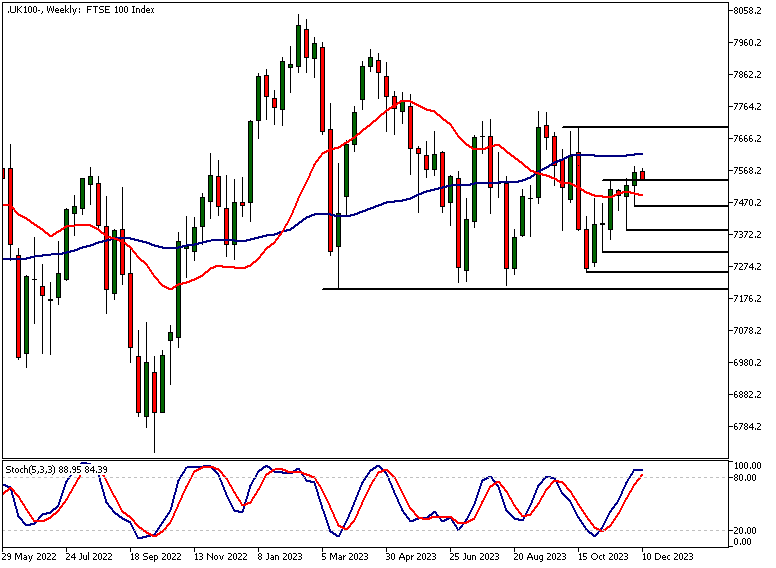
The market has been moving slowly higher, with only one down week since it started attracting buyers at the end of October. Gains have been quite modest compared to the DAX, the other major European equity index. Nonetheless, the FTSE 100 has provided plenty of opportunities to participate on the long side and has been able to push higher by over 4% since the October low.
The market created a higher weekly low last week, while the previous weekly low was, in fact, a higher swing low, signalling that the market is bullish as it is moving higher from a weekly range low.
Lack of long-term trend
Moving averages based on FTSE 100 technical analysis also indicates that the market is in a long-term sideways range in the weekly chart. There is no clear trend long-term trend in the averages: The SMA(20) is pointing lower, while the SMA(50) is pointing upwards.
The 4% up move since the October low has pushed the Stochastic oscillator into an overbought area. However, traders should treat this indication with caution as the market is not yet near the upper end of the price range, and the indication might not, therefore, be reliable.

Daily FTSE 100 technical analysis
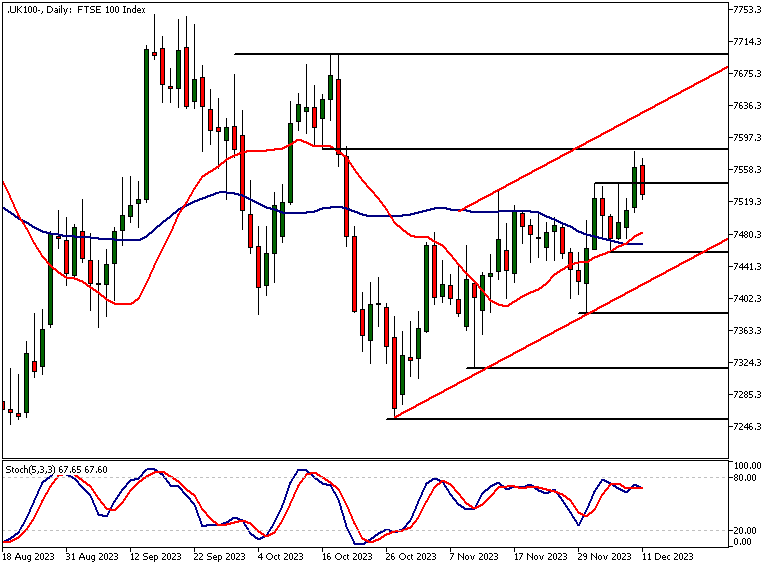
The FTSE rally on Friday was thwarted at a market structure level (7582) that had previously supported FTSE in mid-October. However, the market remains in an uptrend as it continues to create higher lows and higher highs. Indicator-based FTSE 100 technical analysis suggests the same, with the SMA(20) pointing higher and the market trading above the moving averages.
The nearest support levels to focus on in the daily chart are 7384 and 7458. If the market fails to attract buyers at the nearest support level, a move down to 7420 could be likely. Alternatively, we could see a trend continuation move to 7600.

FTSE 100 technical analysis, 8h chart
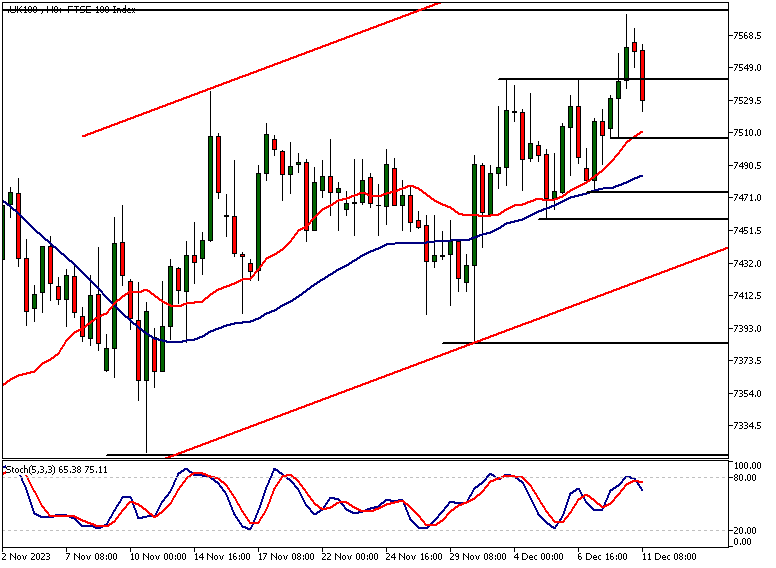
The 8-hour chart reveals a complete inside candle after the rally was halted near the 7582 resistance level. This indication was bearish and resulted in the market trading lower today.
Those following indicator-based FTSE 100 technical analysis might have noticed how the Stochastic oscillator has become overbought and has given a sell signal. The market, however, is in an uptrend, which suggests that traders (and investors) might be looking to buy the dips. The nearest 8-hour support levels are 7458, 7474, and 7507.

Client sentiment analysis
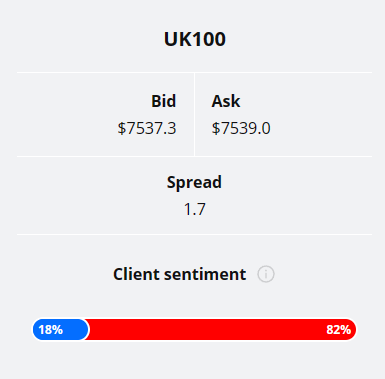
TIOmarkets clients are strongly bearish on FTSE 100 with 82% of clients holding short positions and only 18% holding long positions in the market.
Please remember that the retail trader client sentiment is a contrarian indicator as most of the retail traders are on average betting against the market trends. This is why, experienced traders tend to trade against the retail client sentiment. You can follow the TIOmarkets client sentiment live on our Forex dashboard.
The next key risk events impacting this market
- Claimant Count Change
- Average Earnings Index 3m/y
- GDP m/m
- Monetary Policy Summary
- MPC Official Bank Rate Votes
- Official Bank Rate
- Flash Manufacturing PMI
- Flash Services PMI

Potential FTSE 100 Market Moves
The nearest support levels to focus on in the daily chart are 7384 and 7458. If the market fails to attract buyers at the nearest support level, a move down to 7420 could be likely. Alternatively, we could see a trend continuation move to 7600.
How would you trade the FTSE 100 today?
I hope this fundamental and technical FTSE 100 analysis helps you to make better informed trading decisions. Check the latest market analysis for other instruments and subscribe to receive them in your inbox as soon as they are published
While research has been undertaken to compile the above content, it remains an informational and educational piece only. None of the content provided constitutes any form of investment advice.
Tio Markets UK Limited is a company registered in England and Wales under company number 06592025 and is authorised and regulated by the Financial Conduct Authority FRN: 488900
Risk warning: CFDs are complex instruments and come with a high risk of losing money rapidly due to leverage. 82% of retail investor accounts lose money when trading CFDs with this provider. You should consider whether you understand how CFDs work and whether you can afford to take the high risk of losing your money. Professional clients can lose more than they deposit. All trading involves risk.
DISCLAIMER: TIO Markets offers an exclusively execution-only service. The views expressed are for information purposes only. None of the content provided constitutes any form of investment advice. The comments are made available purely for educational and marketing purposes and do NOT constitute advice or investment recommendation (and should not be considered as such) and do not in any way constitute an invitation to acquire any financial instrument or product. TIOmarkets and its affiliates and consultants are not liable for any damages that may be caused by individual comments or statements by TIOmarkets analysis and assumes no liability with respect to the completeness and correctness of the content presented. The investor is solely responsible for the risk of his/her investment decisions. The analyses and comments presented do not include any consideration of your personal investment objectives, financial circumstances, or needs. The content has not been prepared in accordance with any legal requirements for financial analysis and must, therefore, be viewed by the reader as marketing information. TIOmarkets prohibits duplication or publication without explicit approval.

Janne Muta holds an M.Sc in finance and has over 20 years experience in analysing and trading the financial markets.
