Risk disclaimer: 76% of retail investor accounts lose money when trading CFDs and Spreadbets with this provider. You should consider whether you understand how CFDs and Spreadbets work and whether you can afford to take the high risk of losing your money.
FTSE 100 technical analysis | Buying coming in after a 3% decline?
BY Janne Muta
|October 25, 2023FTSE 100 technical analysis reveals the index in a wide trading range as the UK economy is facing moderate growth and significant challenges. The GDP growth rate has decelerated while the inflation rate at 6.7%, surpasses the Bank of England's 2% target.
Inflation and Labour
High inflation erodes consumer spending power and pressures the ever-so-important services sector. This shows in rising unemployment and sluggish job creation. Retail sales have contracted, and consumer confidence is waning which could lead to a further slowdown of the economy.
FTSE 100 Analysis
Coupled with a cautious economic outlook, our FTSE 100 technical analysis reveals the market trading lower by 3% last week. This has resulted in bearish positioning of moving averages in the daily and 4h timeframe charts and a Stochastic Oscillator nearing the oversold threshold in the weekly chart. This is noteworthy as the market is now approaching the lower end of the weekly timeframe price range and could soon result in both technical and value driven buying in UK stocks.
The next key risk events for FTSE 100 are
- BoE Consumer Credit
- S&P Global/CIPS Manufacturing PMI Final
- BoE Interest Rate Decision
Read the full FTSE 100 technical analysis report below.
FTSE 100 technical analysis

Weekly FTSE 100 technical analysis
FTSE declined 3% last week after supply around the previous week's high turned out to be too much for the bulls to absorb. Now the market trades closer to the lower end of a vast sideways range thus possibly soon presenting opportunities on the long side.
Moving Averages Analysis
The moving averages are positioned bearishly with the SMA(20) below the SMA(50) but what's important here in terms of FTSE 100 technical analysis is that the market is moving sideways zig-zagging on both sides of the moving averages. The Stochastic Oscillator is approaching the oversold threshold of 20 (currently at 26).
Role of Oscillators
Indications from oscillators are at their best when the markets are ranging sideways. That's when the oscillators provide the best value. However, by combining the indications with ongoing price action analysis we can further increase the chances of making the right judgement of the market direction.
Weekly Price Range
The lower end of the weekly price range is at 7226, or some 2% below the current price. Our FTSE 100 technical analysis suggests therefore that the right time to buy the market might not yet be here but with the market approaching the range lows it's good to map the key price levels and keep the market on our watchlists.
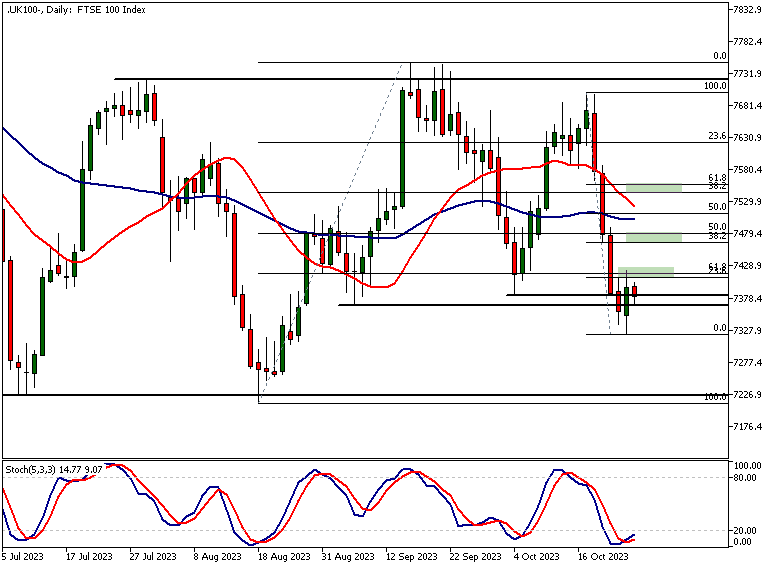
Daily FTSE 100 technical analysis
In the daily chart, the FTSE 100 technical analysis shows the market is trying to move higher. The Stochastic oscillator has (as a result) given a buy signal yesterday but the bulls need to be able to push the market above yesterday's high (7422) in order to stage a daily timeframe rally. The 61.8% Fibonacci retracement coincides with yesterday's high, adding to the significance of this level.
Fibonacci Cluster Analysis
Using Fibonacci cluster analysis we can see the 23.6% retracement level roughly coinciding with the 61.8% level. Another cluster is formed at the 7465 - 7479 range and the one above this can be found at 7544 - 7558. The clusters are formed by adding another set of Fibonacci retracement levels to the chart by drawing the lines from the October 17th high to the latest low.
Potential Price Targets
If the market creates a sustainable rally above yesterday's high, our FTSE 100 technical analysis suggests, the bulls could be targeting these price ranges. A measured move target projection from the potential base points to the SMA(50) which currently is at 7520.
Trading Strategies
This could lead to either market slowing down near these ranges or possibly retracing lower from them. Whatever the case, follow the price action and trade accordingly. When there are no clear momentum indications stay in cash until you can see that your edge is present in the market.
Market Structure Levels
Note that the latest daily swing high is below the previous one and the market has just violated two key market structure levels (7367 and 7382). Therefore, the market could still be heading lower and testing the weekly range low.
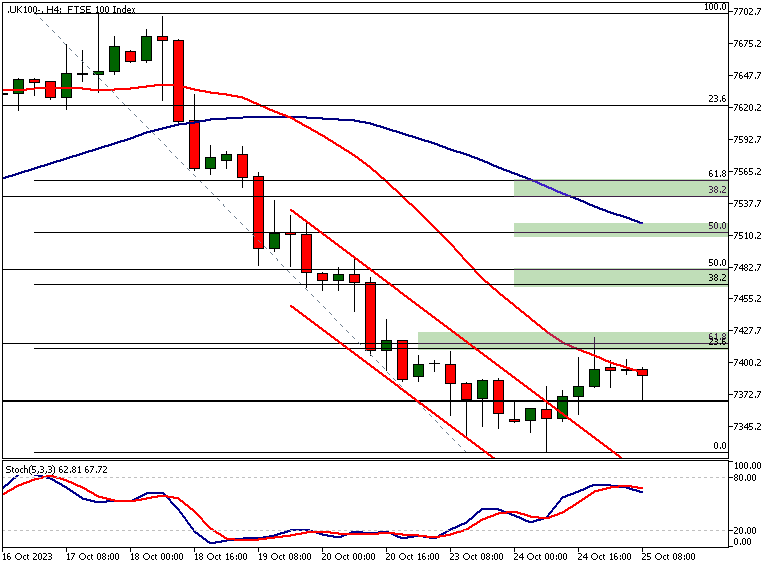
FTSE 100 technical analysis, 4h chart
The 4h FTSE 100 technical analysis shows the market rallying out of a descending trend channel yesterday. The rally lost steam at the Fibonacci cluster area and has since moved sideways.
Moving Averages
The moving averages are still bearish indicating lower prices but if the market can create a higher swing low above yesterday's low (7322) and close above the 7422 level we could see a move to the 7465 - 7479 range and then possibly to the 7544 - 7558 range on extension.
Scenarios on Rally Failure
Should the rally attempt fail and the market closes below yesterday's low, a move to the weekly range low at 7214 could be likely. At the moment the moving averages pointing lower together with the bearish 4h Stochastics suggest this.
Bullish Market Signs
However, the market has just recently shown some strength and moved out of the bearish trend channel which shows that the bulls are trying to turn the market higher.
The key takeaways from this report are
- The UK economy in Q2 2023 shows a decelerated GDP growth of 0.2%. High inflation at 6.7% impacts real incomes, indicating a cautious economic outlook.
- The weekly FTSE 100 technical analysis reveals a 3% decline. The Stochastic Oscillator is nearing the oversold threshold at 26, suggesting a bearish market direction.
- In the daily FTSE 100 chart, the Stochastic oscillator gave a buy signal. Bulls need to surpass yesterday's high at 7422, which aligns with the 61.8% Fibonacci retracement level.
- The weekly price range low for FTSE 100 is at 7226, approximately 2% below the current price. Trading strategy suggests it's not yet the right time to buy.
- On the 4h FTSE 100 chart, the market shows signs of rallying. Bearish moving averages and Stochastics indicate lower prices, but bulls are attempting to turn the market higher.
- Key Fibonacci clusters in the daily FTSE 100 chart are found at ranges 7465-7479 and 7544-7558. These levels could serve as potential targets for bulls if a rally sustains.
Read more FTSE 100 technical analysis

The next main risk events
- CAD - BOC Monetary Policy Report
- CAD - BOC Rate Statement
- CAD - Overnight Rate
- USD - New Home Sales
- CAD - BOC Press Conference
- EUR - ECB President Lagarde Speaks
- USD - Fed Chair Powell Speaks
- EUR - Main Refinancing Rate
- EUR - Monetary Policy Statement
- USD - Advance GDP
- USD - Unemployment Claims
- USD - Advance GDP Price Index
- USD - Core Durable Goods Orders
- USD - Durable Goods Orders
- EUR - ECB Press Conference
- USD - FOMC Member Waller Speaks
- USD - Pending Home Sales
- JPY - Tokyo Core CPI
- NZD - RBNZ Statement of Intent
- USD - Core PCE Price Index
- USD - Revised UoM Consumer Sentiment
For more information and details see the TIOmarkets economic calendar.
While research has been undertaken to compile the above content, it remains an informational and educational piece only. None of the content provided constitutes any form of investment advice.
Tio Markets UK Limited is a company registered in England and Wales under company number 06592025 and is authorised and regulated by the Financial Conduct Authority FRN: 488900
Risk warning: CFDs are complex instruments and come with a high risk of losing money rapidly due to leverage. 82% of retail investor accounts lose money when trading CFDs with this provider. You should consider whether you understand how CFDs work and whether you can afford to take the high risk of losing your money. Professional clients can lose more than they deposit. All trading involves risk.
DISCLAIMER: Tio Markets offers an exclusively execution-only service. The views expressed are for information purposes only. None of the content provided constitutes any form of investment advice. The comments are made available purely for educational and marketing purposes and do NOT constitute advice or investment recommendation (and should not be considered as such) and do not in any way constitute an invitation to acquire any financial instrument or product. TIOmarkets and its affiliates and consultants are not liable for any damages that may be caused by individual comments or statements by TIOmarkets analysis and assumes no liability with respect to the completeness and correctness of the content presented. The investor is solely responsible for the risk of his/her investment decisions. The analyses and comments presented do not include any consideration of your personal investment objectives, financial circumstances, or needs. The content has not been prepared in accordance with any legal requirements for financial analysis and must, therefore, be viewed by the reader as marketing information. TIOmarkets prohibits duplication or publication without explicit approval.

Janne Muta holds an M.Sc in finance and has over 20 years experience in analysing and trading the financial markets.
