Risk disclaimer: 76% of retail investor accounts lose money when trading CFDs and Spreadbets with this provider. You should consider whether you understand how CFDs and Spreadbets work and whether you can afford to take the high risk of losing your money.
EURAUD technical analysis | EURAUD trades near the weekly bull channel low
BY Janne Muta
|October 10, 2023The EURAUD technical analysis shows the market in the weekly timeframe near the ascending trend channel's lower end while our daily EURAUD technical analysis focuses to a contra-trend descending channel.
Intraday Targets
Shifting to a 4-hour time frame, the market's descent into oversold territories, as depicted by the stochastic oscillator, outlines short-term market dynamics. With the market rebounding from support, the ensuing price action, particularly around the resistance level of 1.6504, is critical.
Intraday EURAUD analysis reveals potential targets, aligning with key moving averages, poised to influence intraday trader sentiment. Another factor impacting the market is the Australian consumer and business sentiment data released earlier today and China New Loans and the speech by the ECB President Lagarde later on today.
Consumer Sentiment
The Westpac-Melbourne Institute Consumer Sentiment index in Australia increased to 82 in October 2023, reflecting a 2.9% rise, yet remains in a pessimistic domain due to ongoing inflation and rate rise concerns despite the RBA's pause on rate hikes.
Business Confidence: Steady Yet Low
Concurrently, the NAB business confidence index steadied at 1 in September 2023, indicating sustained low confidence levels among firms, although business conditions exhibited a slight moderation.
Mixed Signals
Notable shifts include a decline in profitability and employment metrics across certain sectors, and a dip in purchasing costs. These indices collectively suggest a cautious consumer outlook and a muted business sentiment amidst cost pressures, underlining a mixed economic scenario.
The next key risk events for EURAUD are
- China New Loans
- ECB President Lagarde Speaks
- US PPI and Core PPI
- US CPI and Core CPI
Read the full EURAUD technical analysis report below
EURAUD technical analysis

Weekly EURAUD technical analysis
The weekly chart shows how the market has rallied by almost 20% in about a year. Since hitting the year-to-date high at 1.7064, the market has retraced about 3.3%. This retracement has taken EURAUD almost to the ascending trend channel low before the market started to attract buyers two weeks ago.
Momentum Indicators: A Bullish Sign
Since then, we have seen a reaction higher and the stochastic oscillator has given a buy signal. Both moving averages, the 20 and the 50 period, are pointing higher. The fast moving average is above the slow, indicating that the market still has upside momentum. Another bullish sign is that last week's low was higher than the previous. Therefore, based on our EURAUD technical analysis, the uptrend is still in force.
Technical Confluence Area: A Trading Zone
The market is currently trading between a technical confluence area created by the September low at 1.6320 and the 38.2% Fibonacci retracement level that coincides with the ascending trend channel low. If the market broke below this confluence area, the technical picture would change.
Potential Market Scenarios: Looking Ahead
Under that scenario, we might see the market trading down to the 50% Fibonacci retracement level at 1.6142. This level coincides with the 50-period moving average at 1.6113. On the other hand, if the bulls are able to push the market above 1.664, we should look for a move to 1.6800 or so.

Daily EURAUD technical analysis
The daily chart reveals how the market is moving inside a contra-trend descending trend channel. Four days ago, the market tried to break out of this channel, but the rally failed and the stochastic oscillator gave a sell signal. The reason for the rally failure was the resistance level created by the 23.6% Fibonacci retracement level and a market structure level at 1.6645.
Market Strength: A Necessary Breakout
The market obviously needs to break out of this descending price channel in order to continue the long-term uptrend. Currently, the fast moving average is below the slow, indicating that the market is not as strong as it used to be during the summer months.
Price Action Analysis: Critical Days Ahead
However, our EURAUD technical analysis shows that the market is trading fairly close to the lower end of a long-term ascending price channel. Therefore, the price action that follows over the next few days is highly critical. If the market is able to create a higher reactionary low inside the long-term uptrend channel, we have further confirmation that the bulls are still committed to moving this market higher.
Fibonacci Retracement: A Look Below
But, if they let the market slip below 1.6420 and the break of the support is decisive, then we might see the market trading down to the 50% Fibonacci retracement level as explained in our weekly EURAUD technical analysis above.
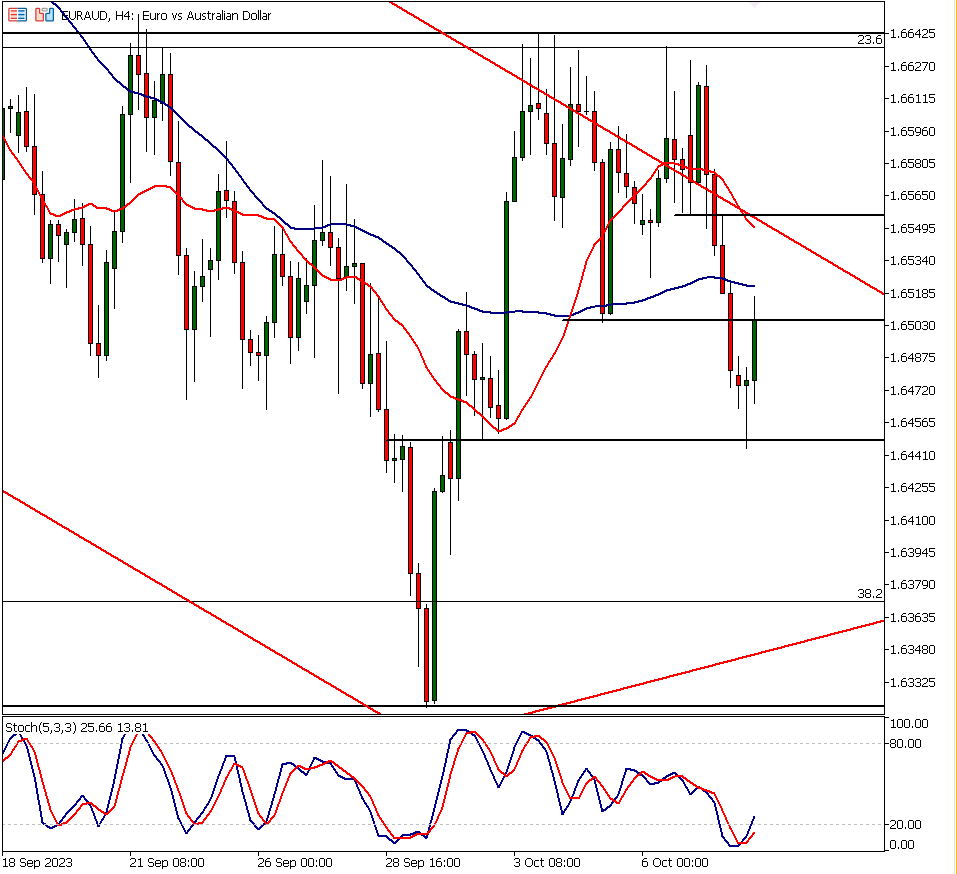
EURAUD technical analysis, 4h
The 4-hour chart shows that EURAUD has dropped quite a bit, pushing the stochastic oscillator into oversold territory. Since then, the oscillator has given a buy signal in this timeframe. At the moment, the market is trying to bounce back from two market structure levels at 1.6448 and 1.6460.
Resistance Challenge: Bullish Hopes
While the market's bounce from a support level is a positive sign for the bulls, it's imperative to witness some follow-through buying propelling the market beyond the 1.6504 resistance threshold. However, we need to see more buying action to push the market above the 1.6504 resistance level to valide a more bullish EURAUD technical analysis view. If this level holds strong or if the prices above it don’t stick, there's a substantial risk of EURAUD trading lower, heading towards the long-term ascending trend channel low.
Upcoming Price Targets: A Glimpse Up
Looking up, the next point of interest after 1.6504 is around 1.6557, which lines up with the 20-period moving average. A solid break above this could clear the path to 1.6633. That’s why the price action over the next few hours is key and could shape the intraday trader sentiment for the rest of the day.
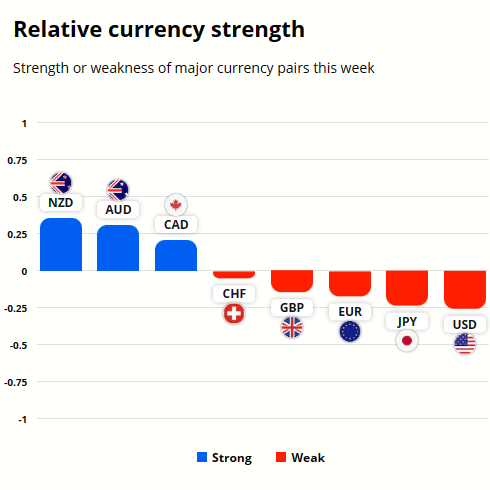
EUR and AUD Currency Strength Analysis
The EUR is considerably weaker than the AUD while the NZD is the strongest and the USD the weakest.
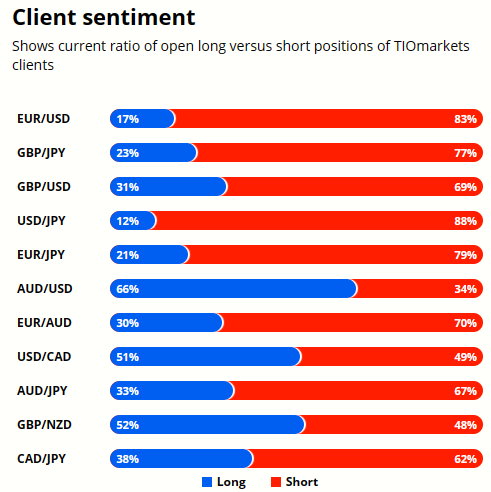
Most retail traders are bullish on EURAUD with 70% of them holding long positions and 30% shorting the market. Read the above EURAUD technical analysis to assist you in how to apply the client sentiment data.
Please remember that the retail trader client sentiment is a contrarian indicator as most of the retail traders are on average betting against the market trends. This is why, experienced traders tend to trade against the retail client sentiment. You can follow the TIOmarkets client sentiment live on our Forex dashboard.
The key takeaways from this report
- The weekly EURAUD analysis reveals a rally of nearly 20% over the past year with a 3.3% retracement lately, bringing the market close to the ascending trend channel's lower boundary. Notable support and resistance levels include 1.6320 and 1.664 respectively, dictating potential market scenarios.
- On the daily timeframe, EURAUD is navigating within a contra-trend descending channel, facing resistance at 1.6645 marked by a 23.6% Fibonacci retracement level. The market's strength is challenged, requiring a decisive breakout to continue the long-term uptrend.
- Shifting to a 4-hour chart, a descent into oversold territories is observed with the stochastic oscillator signalling a buy. Key resistance at 1.6504 and subsequent target at 1.6557 are critical for bullish prospects, reflecting short-term market dynamics.
- The Australian consumer sentiment index rose to 82, yet remains pessimistic amid inflation fears, despite the RBA's pause on rate hikes. Concurrently, a steady but low NAB business confidence index at 1 reflects muted business sentiment, painting a mixed economic picture.
- The EUR's strength is considerably weaker compared to the AUD, with retail trader sentiment showing 70% bullishness on EURAUD. This contrarian indicator suggests cautious optimism as most retail traders tend to bet against market trends.
- Key risk events such as speeches by ECB President Lagarde and the release of US PPI, Core PPI, CPI, and Core CPI data, are on the horizon. These events could significantly impact EURAUD trading, necessitating a keen eye on economic calendars for informed trading decisions.
Read more analysis on AUD
Read more analysis on EUR
We hope that our EURAUD technical analysis helps our readers to make better trading decisions!

The next main risk events
- CNY - New Loans
- EUR - ECB President Lagarde Speaks
- USD - FOMC Member Waller Speaks
- USD - Core PPI m/m
- USD - PPI m/m
- USD - FOMC Member Waller Speaks
- USD - FOMC Meeting Minutes
- GBP - GDP m/m
- USD - Core CPI m/m
- USD - CPI m/m
- USD - CPI y/y
- USD - Unemployment Claims
- CNY - CPI y/y
- CNY - PPI y/y
- GBP - BOE Gov Bailey Speaks
- EUR - ECB President Lagarde Speaks
- USD - FOMC Member Harker Speaks
- USD - Prelim UoM Consumer Sentiment
- USD - Prelim UoM Inflation Expectations
- GBP - BOE Gov Bailey Speaks
- EUR - ECB President Lagarde Speaks
For more information and details see the TIOmarkets economic calendar.
While research has been undertaken to compile the above content, it remains an informational and educational piece only. None of the content provided constitutes any form of investment advice.
Tio Markets UK Limited is a company registered in England and Wales under company number 06592025 and is authorised and regulated by the Financial Conduct Authority FRN: 488900
Risk warning: CFDs are complex instruments and come with a high risk of losing money rapidly due to leverage. 82% of retail investor accounts lose money when trading CFDs with this provider. You should consider whether you understand how CFDs work and whether you can afford to take the high risk of losing your money. Professional clients can lose more than they deposit. All trading involves risk.
DISCLAIMER: Tio Markets offers an exclusively execution-only service. The views expressed are for information purposes only. None of the content provided constitutes any form of investment advice. The comments are made available purely for educational and marketing purposes and do NOT constitute advice or investment recommendation (and should not be considered as such) and do not in any way constitute an invitation to acquire any financial instrument or product. TIOmarkets and its affiliates and consultants are not liable for any damages that may be caused by individual comments or statements by TIOmarkets analysis and assumes no liability with respect to the completeness and correctness of the content presented. The investor is solely responsible for the risk of his/her investment decisions. The analyses and comments presented do not include any consideration of your personal investment objectives, financial circumstances, or needs. The content has not been prepared in accordance with any legal requirements for financial analysis and must, therefore, be viewed by the reader as marketing information. TIOmarkets prohibits duplication or publication without explicit approval.

Janne Muta holds an M.Sc in finance and has over 20 years experience in analysing and trading the financial markets.
