Risk disclaimer: 76% of retail investor accounts lose money when trading CFDs and Spreadbets with this provider. You should consider whether you understand how CFDs and Spreadbets work and whether you can afford to take the high risk of losing your money.
DAX technical analysis | How the Middle East Crisis is Weighing Down on DAX
BY Janne Muta
|October 16, 2023Dax technical analysis - The unfolding Middle East crisis has pressured the DAX index as well as the other major equity indices worldwide. The crisis has resulted in a surge in oil prices, increasing operational costs for German industries, particularly those with high energy consumption. This has sparked concerns of eroded profitability and consequently, adversely affected stock valuations within the DAX index.
Influence of U.S. CPI on Equity Markets
Compounding these issues, higher than expected U.S. CPI sent the DJIA, S&P 500 and Nasdaq lower as investors feared the Fed reaction. Geopolitical uncertainties have induced a shift in investor behaviour, with a discernible movement towards safe-haven assets like U.S. T-Bonds and gold at the expense of equities.
Monetary Policy and Attractiveness of Equities
Potential interest rate hikes by central banks to combat inflation, could make equities less attractive compared to bonds. Furthermore, the imposition of trade sanctions could disrupt international trade, affecting companies with global operations.
DAX Technical Analysis and Market Outlook
Our DAX technical analysis report below indicates key resistance and support levels that could provide with trading opportunities. The current technical picture suggest a bearish outlook unless a decisive rally occurs.
Overall, the DAX index has seen a significant increase in downside volatility lately. This suggests our readers should have plenty of trading opportunities in this market over the coming days.
The next key risk events for DAX are
- Empire State Manufacturing Index
- German ZEW Economic Sentiment
- US Retail Sales
Read the full DAX technical analysis report below
DAX technical analysis
Weekly DAX technical analysis
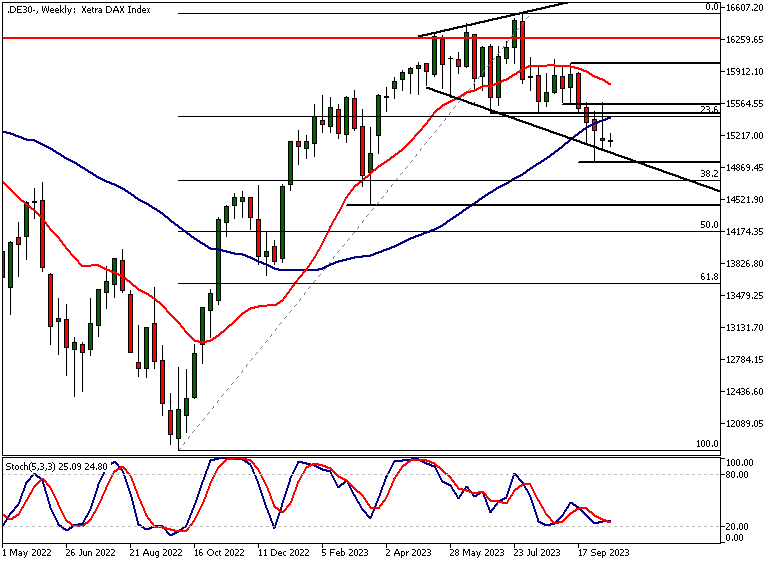
Last week DAX rallied to a resistance area and failed to penetrate it. The area, created by a market structure level, the SMA(50) and the 23.6% Fibonacci retracement level at 15,454, invited profit-taking and short sellers sending the market lower again.
Key Market Structure Level
Our Dax technical analysis suggests that last week's high at 15,575 is now the key market structure level the Dax needs to penetrate to change the bearish technical picture in the weekly timeframe chart. This could open the way for the market to rally to 15,980 or so.
Importance of Monitoring Price Action
On the other hand, the above-mentioned technical factors at the 15,454 - 15,575 range, could act as a resistance area again. Therefore, should the market rally back to the level, we need to monitor price action in the smaller timeframe charts to see if it has enough strength to push through the area or if the price action inside the confluence zone indicates that the bears step in again.
Market Context
The market is trading below a key resistance area and it has just recently created a topping formation (a widening top formation, see our previous DAX report). Therefore last week's rally failure is hardly a surprise to anyone.
Potential for Further Weakness
The market has been weak and therefore further weakness could emerge unless we see a decisive rally above the 15,454 - 15,575 confluence area. As per our Dax technical analysis, the potential move to the downside could take the market down to the March low at 14,460.
SMAs Signalling Weakness
The SMA(50) is still pointing higher but the market is now trading below the slow SMA(50) and the fast SMA(20) is pointing lower. These are signs of weakness and the market needs to start showing signs of weakness before the expected value for P&L on the long side can increase substantially. A rally above the confluence area would certainly help in this regard.
Daily DAX technical analysis
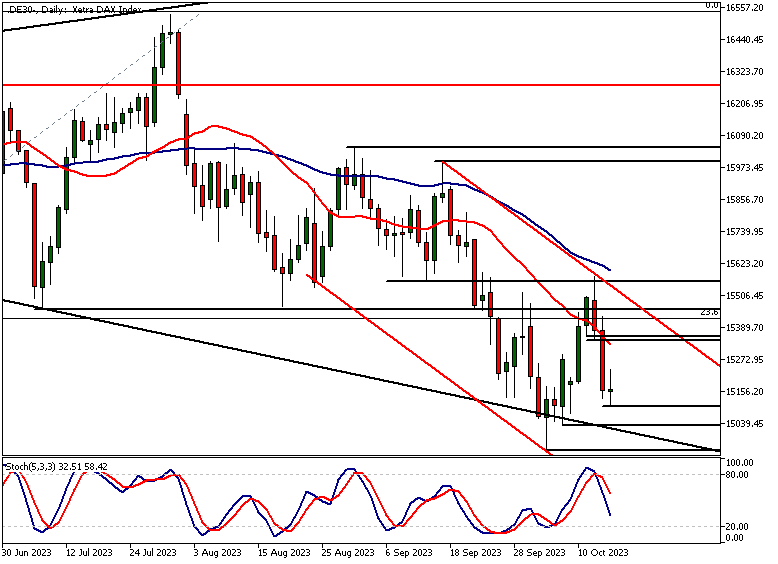
In the daily chart, Dax ranges between the October 4th low (14,944) and the confluence area we referred to above in the weekly Dax technical analysis section. The upper end of the consolidation aligns with the weekly resistance area discussed above and the index trades inside a bearish trend channel. The channel top is currently at 15,528.
Implications of Friday's Strong Sell-off
Friday's sell-off was strong with Dax losing over 200 points (1.4%). Strong momentum days like this are often followed by further weakness. This could lead to the Dax testing the 14,944 low again.
Timing of Market Weakness
Note, however, that there are times when the weakness indicated by a strong momentum candle doesn't appear on the following day but a little later. Sometimes, the market consolidates after a strong price move and only continues in the direction of the initial momentum move a day or two later.
Indicators Confirming Market Weakness
Dax technical analysis with indicators confirms the weakness seen in the index. The moving averages are pointing lower and the fast SMA(20) is below the slow SMA(50) indicating the market is rather weak.
The stochastic oscillator gave a sell signal on Friday's close. The signal came rather late (after the market had declined substantially) highlighting one of the weaknesses in trading systems based on this indicator.
DAX technical analysis, 4h
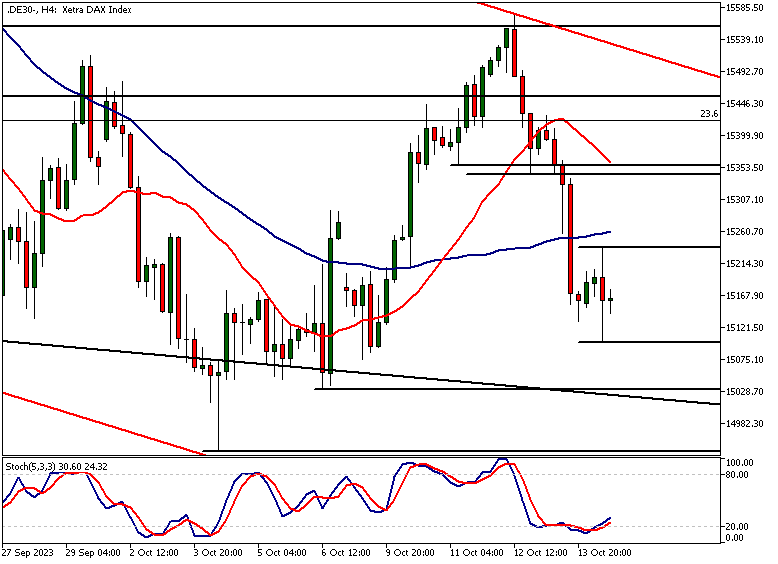
The 4h chart shows the index trading lower after the Frankfurt cash session opened for trading. Since the initial move, the market has stabilised somewhat.
Apart from this, the index shows signs of weakness also in the 4h chart and would need to rally decisively above 15,235 in order to rally higher. Our Dax technical analysis identifies the nearest key resistance area above the 15,235 at 15,344 - 15,438.
Theoretical Scenario of a Higher Swing Low
This in theory could create a higher swing low in the index but at the moment there are no signs of this being a likely scenario. However, a sustained rally above the 15,235 level could change this.
Downside Targets Under Key Support Levels
Below the 15,102 support level, traders probably target the next key 4h support level (15,034) and should it not attract buyers the market could be likely to trade down to the October 4th low we referred to in the weekly section of this Dax technical analysis report.
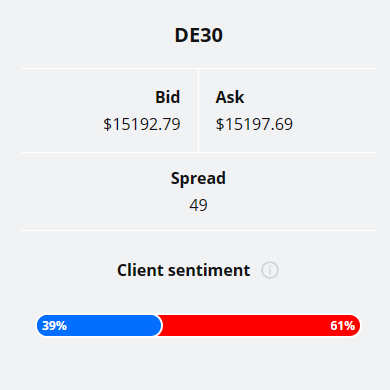
TIOmarkets' clients are currently slightly bullish on DAX with 61% of the clients longand 39% short the market. Therefore, there client sentiment analysis doesn't provide strong indication in either direction.
Please remember that the retail trader client sentiment is a contrarian indicator as most of the retail traders are on average betting against the market trends. This is why, experienced traders tend to trade against the retail client sentiment. You can follow the TIOmarkets client sentiment live on our Forex dashboard.
Middle East Crisis, fundamental impact
The unfolding crisis in the Middle East has pressured DAX as well as the other major equity indices. This crisis has led to a notable surge in oil prices, consequently impacting sectors that heavily rely on energy and instigating concerns related to inflation.
Influence of U.S. Inflation
This deepened the investor concerns after equity indices were already trading lower in response to higher-than-expected inflation readings from the US the last week.
Increased Operational Costs for German Industries
In this economic environment, German industries with substantial energy consumption are facing higher operational costs. Elevated costs could erode profitability and, consequently, lead to lower valuations for DAX stocks.
Geopolitical Tensions and Oil Price Surge
One immediate consequence of the crisis is the surge in oil prices. USOIL has rallied approximately 6% since the Hamas attack on Israel. Geopolitical tensions often disrupt oil supplies, leading to increased operational costs for sectors such as manufacturing and transportation.
These inflationary pressures can, in turn, diminish consumer spending and real earnings, ultimately impacting stock valuations.
Shift in Investor Behavior
Moreover, the crisis often prompt a shift in investor behavior. As geopolitical risks intensify, there is a discernible movement towards safe-haven assets, notably the T-Bond market and gold. This reallocation of capital frequently occurs at the expense of equities, resulting in reduced investment and subsequently, lower stock prices.
The fundamental information alone, however, isn't sufficient to provide traders with timing signals. This is where our DAX technical analysis section of this report can be helpful.
Sectors that heavily rely on discretionary spending, including tourism and retail, also experience adverse effects as consumers tend to become more cautious during periods of uncertainty.
Policy Response and Monetary Implications
Furthermore, the policy response to the crisis can exacerbate these challenges. Rising inflation may exert pressure on central banks to adjust monetary policies, potentially leading to increases in interest rates. Historically, such rate hikes have made equities less appealing when compared to bonds.
Potential for Trade Disruptions
Additionally, the imposition of new sanctions against countries involved in the conflict could trigger a retaliatory spiral, adversely affecting international trade. This, in turn, could harm companies with global operations, adding another layer of complexity to the impact of the Middle East crisis on the DAX index.
We hope that our DAX technical analysis report helps you to make better trading decisions as you seek to understand how the various risk factors (potentially higher oil price and inflation due to geopolitical challenges) impact the markets.
The key takeaways from this report
- The crisis in Israel has compounded existing investor concerns about inflation, especially after higher-than-expected U.S. inflation data was released. The DAX and other equity markets reacted negatively, indicating increased investor caution.
- Last week's DAX high at 15,575 serves as a key resistance level. The market needs to break this level to shift from a bearish to a bullish outlook. This resistance coincides with the SMA(50) and serves as a pivotal point for traders.
- The DAX is currently trading within a bearish trend channel with the channel top at 15,528. The market shows signs of further weakness, and a break below the 15,102 support level could open the path towards the next 4h support at 15,034.
- The DAX index ranges between the October 4th low (14,944) and the 15,575 resistance. A strong sell-off on Friday, resulting in a loss of over 200 points, indicates potential for further downside. Traders should watch for a test of the 14,944 low.
- The fast SMA(20) is pointing lower and is below the slow SMA(50), signalling market weakness. The stochastic oscillator gave a late sell signal, cautioning traders about the timing of market moves. Monitoring these indicators is crucial for intra-day strategies.
- The DAX needs to rally decisively above 15,235 to change the current bearish picture. If this level is broken, the next key resistance area lies between 15,344 - 15,438. A failure to break above could see a return to the lower support levels, offering short opportunities.
Read more analysis on DAX

The next main risk events
- USD - Empire State Manufacturing Index
- CAD - BOC Business Outlook Survey
- USD - FOMC Member Harker Speaks
- NZD - CPI
- AUD - Monetary Policy Meeting Minutes
- GBP - Claimant Count Change
- GBP - Average Earnings Index
- EUR - German ZEW Economic Sentiment
- CAD - CPI
- USD - Core Retail Sales
- USD - Retail Sales
- USD - Industrial Production
- AUD - RBA Gov Bullock Speaks
- CNY - Industrial Production
- CNY - GDP
- CNY - Retail Sales
- GBP - CPI
- USD - Building Permits
- USD - FOMC Member Waller Speaks
- USD - FOMC Member Harker Speaks
- AUD - Employment Change
- AUD - Unemployment Rate
- USD - Unemployment Claims
- USD - Philly Fed Manufacturing Index
- USD - Existing Home Sales
- USD - Fed Chair Powell Speaks
- USD - FOMC Member Harker Speaks
- CNY - 1-y Loan Prime Rate
- CNY - 5-y Loan Prime Rate
- NZD - RBNZ Statement of Intent
For more information and details see the TIOmarkets economic calendar.
While research has been undertaken to compile the above content, it remains an informational and educational piece only. None of the content provided constitutes any form of investment advice.
Tio Markets UK Limited is a company registered in England and Wales under company number 06592025 and is authorised and regulated by the Financial Conduct Authority FRN: 488900
Risk warning: CFDs are complex instruments and come with a high risk of losing money rapidly due to leverage. 82% of retail investor accounts lose money when trading CFDs with this provider. You should consider whether you understand how CFDs work and whether you can afford to take the high risk of losing your money. Professional clients can lose more than they deposit. All trading involves risk.
DISCLAIMER: Tio Markets offers an exclusively execution-only service. The views expressed are for information purposes only. None of the content provided constitutes any form of investment advice. The comments are made available purely for educational and marketing purposes and do NOT constitute advice or investment recommendation (and should not be considered as such) and do not in any way constitute an invitation to acquire any financial instrument or product. TIOmarkets and its affiliates and consultants are not liable for any damages that may be caused by individual comments or statements by TIOmarkets analysis and assumes no liability with respect to the completeness and correctness of the content presented. The investor is solely responsible for the risk of his/her investment decisions. The analyses and comments presented do not include any consideration of your personal investment objectives, financial circumstances, or needs. The content has not been prepared in accordance with any legal requirements for financial analysis and must, therefore, be viewed by the reader as marketing information. TIOmarkets prohibits duplication or publication without explicit approval.

Janne Muta holds an M.Sc in finance and has over 20 years experience in analysing and trading the financial markets.
