Risk disclaimer: 76% of retail investor accounts lose money when trading CFDs and Spreadbets with this provider. You should consider whether you understand how CFDs and Spreadbets work and whether you can afford to take the high risk of losing your money.
AUDUSD technical analysis | Australia CPI cooling continues
BY Janne Muta
|August 30, 2023AUDUSD technical analysis serves as a vital tool for traders seeking to understand how the US and Australian macroeconomic data drive the fund flows in the subsequent currencies. This article discusses the latest trends in job openings in the U.S., the cautious stance of the Federal Reserve, and the moderating but high inflation in Australia.
Today's inflation data release shows a 0.3% increase in the CPI for August 2023, a deceleration from the 0.8% increase observed in July. On an annual basis, the CPI registered a 4.9% increase in August, down from 5.4% in July.
We find that while the US job market shows signs of weakening, with job openings dropping to their lowest levels since March 2021, the Federal Reserve appears less inclined to pursue further rate hikes.
On the other side of the pair, Australia grapples with strong labour markets, relatively high inflation, elevated consumer spending, and the complications arising from China's economic slowdown. Cooling inflation and the China risk suggests the RBA is not likely to hike the rates in the near future unless these factors change significantly.
Amidst these fundamental indicators, AUDUSD technical analysis provides traders with essential real-time insights, offering specific entry and exit points, capturing market sentiment, and enabling effective risk management.
The next key risk events impacting this currency pair are ADP Non-Farm Employment Change, US GDP release and China PMI numbers (Thursday).
Read the full AUDUSD technical analysis below.
AUDUSD technical analysis

AUDUSD weekly chart analysis
After touching the descending trendline support (the lower end of a bearish trend channel) we talked about in our previous AUDUSD technical analysis report, the market has recovered a bit.
The Stochastics Oscillator indicating oversold conditions and the last week’s range low was slightly higher than the previous. As a result, the market has traded a little higher and is now trading near the May low (0.6458).
If there’s a sustained rally above this level, we could see a move to the next major resistance level at 0.6595. However, as we pointed out in the previous AUDUSD technical analysis, there is a cluster a technical resistance levels (0.6458 - 0.6521) that could slow the AUD bulls down or even turn the market lower again.

Daily AUDUSD technical analysis
In our AUDUSD technical analysis report from August 17th, we noted how the AUDUSD was relatively far away from the 20 period SMA. Now the market, after creating a higher reactionary low at 0.6380 has bounced back to the moving average.
As a result, we now how have a triangle formation with a resistance line at 0.6488. This is where the bulls need to overcome, not only the moving average resistance but also the resistance line in order to reverse the trend.
If there is a sustained breakout above the 0.6488 level, the market could move to 0.6595. This level is derived from the triangle using a measured move projection. If the levels above 0.6488 can’t be sustained the market might test the last week’s low (0.6380) again.
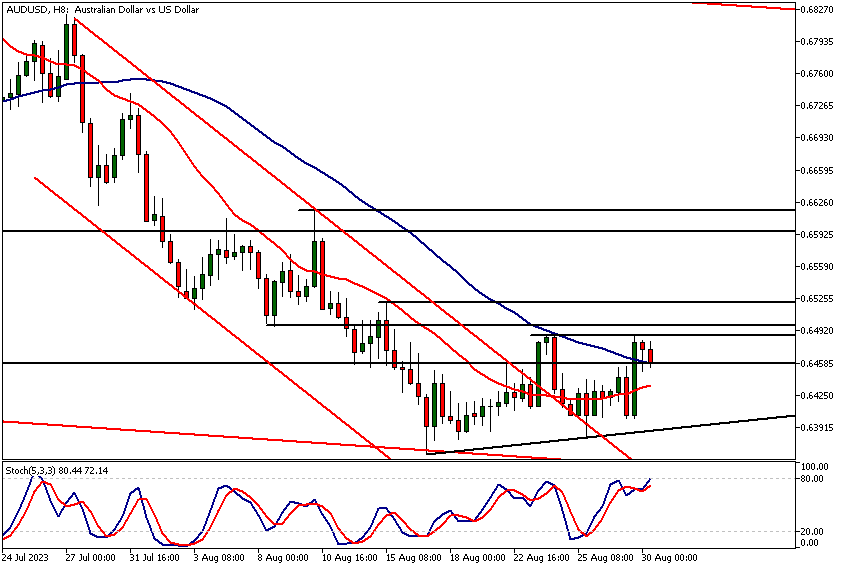
AUDUSD technical analysis, 8h chart
The 8h AUDUSD technical analysis shows how the market has broken out of a descending trend channel. This was the first sign that a trend reversal could be in the works.
The consolidation that followed is yet another sign that selling pressure is easing. Now the green team needs to show they have what it takes to push the market decisively above that key resistance level at 0.6488 in order to complete the trend reversal.
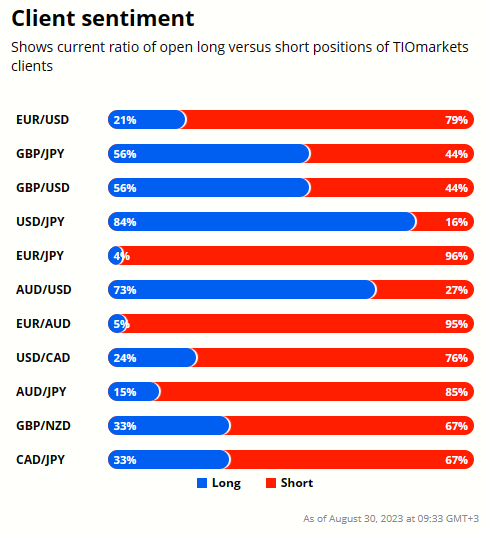
Client sentiment analysis
TIOmarkets' clients have positioned themselves bullish in AUDUSD with 73% of the clients long in this currency pair. Traders should not rely in this indication alone but rather incorporate our AUDUSD technical analysis in their decision making process.
It’s good to remember that the retail trader client sentiment is a contrarian indicator as most of the retail traders are on average betting against the market trends. This is why, experienced traders tend to trade against the retail client sentiment. You can follow the TIOmarkets client sentiment live on our Forex dashboard.
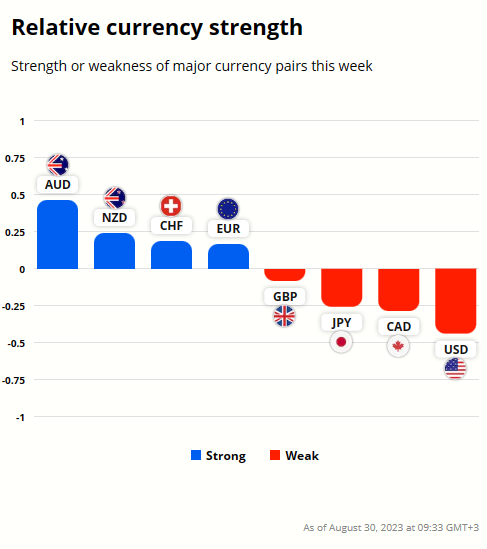
AUD and USD relative currency strength
Currently the AUD is the strongest currency among the major dollar counterparts while the dollar has been under slight pressure following the US JOLTS job openings report yesterday.
AUDUSD fundamental analysis
In July 2023, the number of job openings in the US dropped substantially reduction, falling by 338,000 to 8.827 million. This not only marked the lowest level of job openings since March 2021
Incorporating the data on job openings to macroeconomic data we discussed in the EURUSD technical analysis report yesterday, we see reasons to believe the Fed could restrain from further rate hikes. While consumer spending via Personal Consumption Expenditure (PCE) has slowed, retail sales have been strong.
Meanwhile, inflationary pressures are easing, as evidenced by a modest 0.2% month-over-month increase in Core PCE prices in June. Against this backdrop, the labour market is showing signs of weakness, with job openings dropping significantly for the third consecutive month in July 2023. This marks the lowest level of openings since March 2021 and falls short of market expectations.
The cautious stance of the Federal Reserve
Given this, the Federal Reserve may indeed be less inclined to hike interest rates in the near term. A rate hike could exacerbate the slowdown in the labour market and introduce new uncertainties into an already complex economic environment. Understanding the broader economic landscape through fundamentals is useful, but AUDUSD technical analysis can capture market sentiment that may not yet be reflected in economic data.
Australian economic landscape and RBA policy
Australia's economy is characterized by strong labour markets, elevated consumer spending, and complex inflationary pressures. Additionally, the economic slowdown in China is creating further complications. Though the RBA's monetary policy can set the tone for the Australian Dollar, AUDUSD technical analysis gives traders specific entry and exit points.
Australian inflation data and consumer spending
The latest inflation data today reveals a 0.3% increase in the CPI for August 2023, a deceleration from the 0.8% increase observed in July. On an annual basis, the CPI registered a 4.9% increase in August, down from 5.4% in July. While this decrease suggests some moderation in inflationary pressures, it's worth noting that the rate remains significantly above the RBA's target range of 2-3%.
For traders looking to hedge their positions based on economic indicators, AUDUSD technical analysis can provide the tactical moves for effective risk management.
Conclusion
The US job market is showing signs of vulnerability, with job openings dropping to their lowest levels in over two years. This trend, coupled with a cautious Federal Reserve, suggests that further rate hikes from the Fed may be unlikely in the near term. On the Australian front, a resilient labour market and consumer spending contrast with complex inflationary pressures and the economic slowdown in China. The RBA has thus far maintained a cautious monetary stance, leaving the door open for potential adjustments to its policy. Cooling inflation and the China risk suggests the RBA is not likely to hike the rates in the near future unless these factors change significantly.
For more AUD analysis visit our recent AUDUSD analysis report.

The next main risk events
- USD - ADP Non-Farm Employment Change
- USD - Prelim GDP
- USD - Prelim GDP Price Index
- USD - Pending Home Sales
- CNY - Manufacturing PMI
- CNY - Non-Manufacturing PMI
- EUR - Core CPI Flash Estimate
- EUR - CPI Flash Estimate
- USD - Core PCE Price Index
- USD - Unemployment Claims
- CNY - Caixin Manufacturing PMI
- CHF - CPI
- CAD - GDP
- USD - Average Hourly Earnings
- USD - Non-Farm Employment Change
- USD - Unemployment Rate
- USD - ISM Manufacturing PMI
- USD - ISM Manufacturing Prices
For more information and details see the TIOmarkets economic calendar.
While research has been undertaken to compile the above content, it remains an informational and educational piece only. None of the content provided constitutes any form of investment advice.
Tio Markets UK Limited is a company registered in England and Wales under company number 06592025 and is authorised and regulated by the Financial Conduct Authority FRN: 488900
Risk warning: CFDs are complex instruments and come with a high risk of losing money rapidly due to leverage. 82% of retail investor accounts lose money when trading CFDs with this provider. You should consider whether you understand how CFDs work and whether you can afford to take the high risk of losing your money. Professional clients can lose more than they deposit. All trading involves risk.
DISCLAIMER: Tio Markets offers an exclusively execution-only service. The views expressed are for information purposes only. None of the content provided constitutes any form of investment advice. The comments are made available purely for educational and marketing purposes and do NOT constitute advice or investment recommendation (and should not be considered as such) and do not in any way constitute an invitation to acquire any financial instrument or product. TIOmarkets and its affiliates and consultants are not liable for any damages that may be caused by individual comments or statements by TIOmarkets analysis and assumes no liability with respect to the completeness and correctness of the content presented. The investor is solely responsible for the risk of his/her investment decisions. The analyses and comments presented do not include any consideration of your personal investment objectives, financial circumstances, or needs. The content has not been prepared in accordance with any legal requirements for financial analysis and must, therefore, be viewed by the reader as marketing information. TIOmarkets prohibits duplication or publication without explicit approval.

Janne Muta holds an M.Sc in finance and has over 20 years experience in analysing and trading the financial markets.
