Risk disclaimer: 76% of retail investor accounts lose money when trading CFDs and Spreadbets with this provider. You should consider whether you understand how CFDs and Spreadbets work and whether you can afford to take the high risk of losing your money.
AUDJPY technical analysis | Bearish shooting star in the daily chart
BY Janne Muta
|September 18, 2023This comprehensive AUDJPY technical analysis examines multiple time frames, offering a nuanced understanding of market trends. On a weekly basis, the AUDJPY currency pair has shown bullish tendencies, rallying 13.5% since its March low with a year-to-date performance of 6.5%.
While providing a reliable AUDJPY forecast is not possible without a deep dive into the intricacies of both Australian and Japanese economies and as such outside the scope of this analysis we provide you with a detailed technical analysis. This helps you in drawing your own conclusions as you consider trading this market.
Weekly Performance and Moving Averages
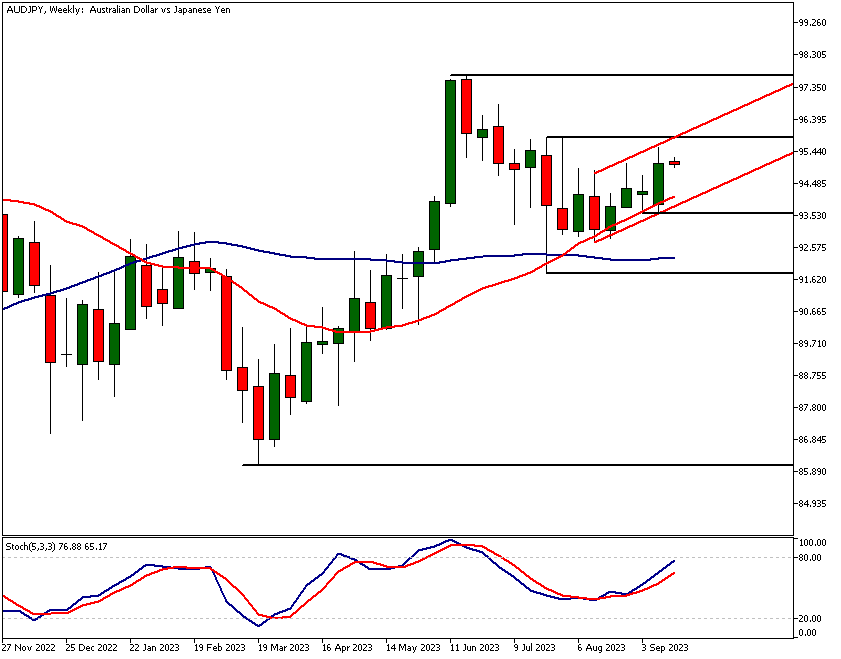
On a weekly basis, the AUDJPY currency pair has exhibited bullish behaviour, rallying 13.5% since its March low. The year-to-date performance stands at 6.5%. The price is trading above the 20-period Simple Moving Average (SMA), which is inclined upwards. In contrast, the 50-period SMA is oriented sideways, indicating a broad price range for the ongoing bullish trend. Key resistance and support levels are pegged at 95.85 and 92.78, respectively.
Stochastic Oscillator and Daily Reversal Signals
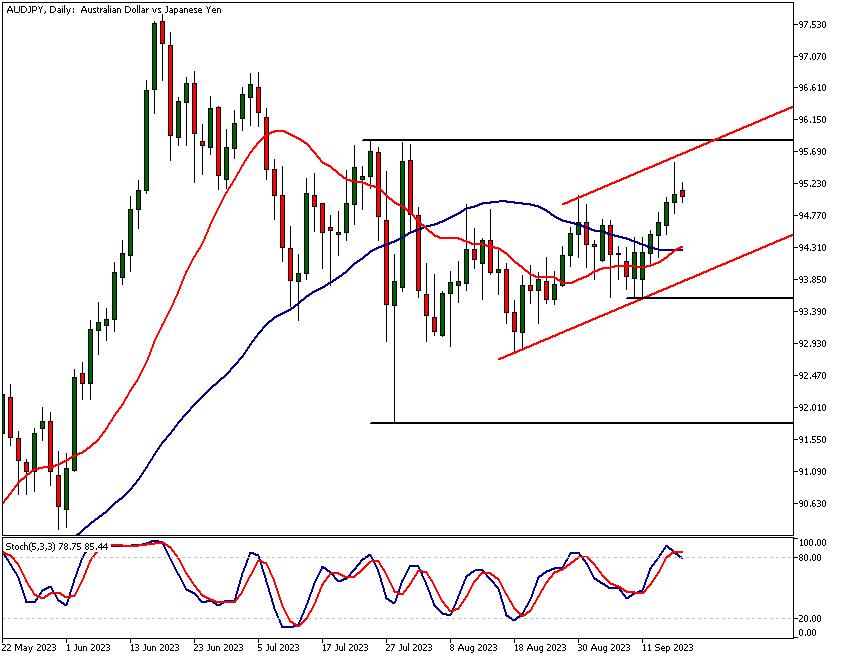
The stochastic oscillator is approaching the overbought zone but hasn't yet provided sufficient grounds for a bearish outlook. However, on the daily timeframe, a potential bearish reversal is indicated by a shooting star candlestick pattern.
Technical Confluence in the 4-Hour Chart
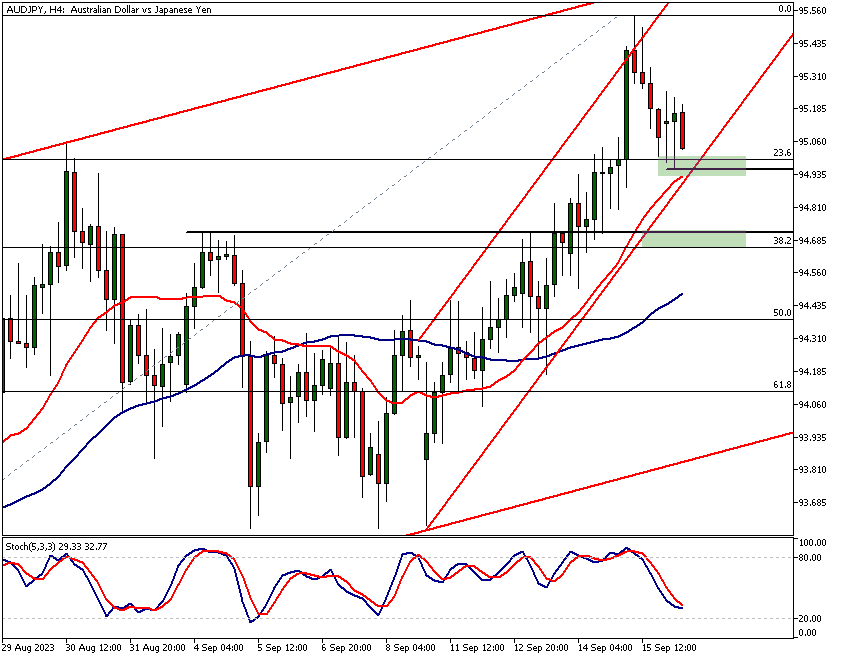
The 4-hour chart presents a technical confluence around the 94.96 level. This involves a 23.6% Fibonacci retracement, the lower boundary of a bullish channel, and the 20-period SMA. These combined factors may have a significant impact on market sentiment and are especially relevant for traders formulating an AUDJPY trading strategy.
The next key risk events for this market are: RBA monetary policy meeting minutes and the BoJ Monetary Policy Statement.
The key takeaways from this report are
- The AUDJPY pair has identified crucial resistance and support levels at 95.85 and 92.78 respectively on the weekly chart. These levels can serve as essential benchmarks for intra-day traders.
- In AUDJPY technical analysis, the stochastic oscillator on the weekly timeframe is nearing the overbought threshold at 80, with a current value of 78.3. This indicator should be monitored for potential shifts in market momentum.
- Today's AUDJPY daily chart features a bearish shooting star candlestick pattern, with the low at 94.84. This pattern signals a possible reversal in bullish momentum and could be a key timing cue for intra-day traders.
- On the 4-hour chart, AUDJPY is trading at a significant technical confluence zone around 94.96, marked by a 23.6% Fibonacci retracement level and the lower boundary of a bullish channel. This area may serve as a focal point for intra-day trading decisions.
- A bullish hammer candlestick pattern has emerged in the AUDJPY 4-hour chart around the 94.96 level. This pattern could influence market sentiment and warrant attention from intra-day traders.
- The stochastic oscillator in the 4-hour AUDJPY chart is near the 40 level, indicating that it may soon issue a buy signal. This could be an essential cue for traders considering AUDJPY's intra-day momentum.
Read the full AUDJPY technical analysis below.
AUDJPY technical analysis
Weekly AUDJPY technical analysis
The AUDJPY currency pair has been trading higher on the weekly chart for the better part of the year. The market has rallied by 13.5% since its low in March, and the current year-to-date performance stands at 6.5%. This comes after a correction lower since the high in June.
Resumed upside momentum and moving averages
Upside momentum has resumed in recent weeks. The fast-moving average (the 20-period SMA) is pointing upwards, and the price is trading above it. The slow-moving average (SMA 50) points sideways. AUDJPY technical analysis thus indicates that the upmove seen over the last two months takes place within a wide price range. The nearest key resistance level is at 95.85 while the nearest major support level in the weekly timeframe is at 92.78.
Bullish momentum indicators
It is noteworthy that, in addition to trading above the fast-moving average, AUDJPY has also created higher weekly lows. These are signs of bullish momentum. Furthermore, last week's candle was a wide-range one, suggesting that further upside movement could be likely in the near term.
Stochastic Oscillator and overbought conditions
At the same time, the stochastic oscillator is oriented upwards and is nearing the overbought threshold, with a current value of 78.3 (the overbought threshold is 80). This indication alone is not sufficient grounds for shorting the market and further AUDJPY technical analysis using price action is needed. Multi-timeframe analysis can be particularly helpful in this.
Daily AUDJPY technical analysis
Today's AUDJPY market behaviour is pivotal. A bearish shooting star pattern on the daily chart suggests potential downward movement. Should the price drop below the low of the shooting star (94.84), this would hint at additional downside risk. An examination of the daily and 4-hour charts provides insights into possible market moves both today and for the coming week.
Indications of momentum shift
On the daily chart, AUDJPY has seen a sustained rally, initiated after forming a higher low at 93.60. Despite this, Friday's price action exhibited signs of diminishing bullish momentum, marked by a bearish shooting star candle. This suggests that bullish traders may not hold sway today.
Stochastic oscillator and channel boundaries
The market's slowing pace became apparent as it approached the upper limit of the bullish price channel, simultaneous with the stochastic oscillator exceeding the 80-point mark. Although the daily trend has been bullish, the recent signals indicate a potential pullback in the gains.
Broader market context
Currently, the uptrend is nested within a wider sideways trading range. The market has yet to break above the high set on 25th June or drop below the low from 28th June. These price levels delineate the ongoing sideways market behaviour of the AUDJPY pair.
AUDJPY technical analysis, 4h chart
The 4-hour chart reveals another ascending price channel within the daily bullish channel. The price rallied above it on Friday before falling back to levels near the lower end of the channel.
Market trades at a key price level
The AUDJPY price action around the 94.96 level could strongly impact market sentiment today. The price has retraced to a crucial 23.6% Fibonacci support level, which closely aligns with the lower boundary of the bullish channel. This Fibonacci level, along with the channel's lower boundary and the SMA(20), forms a significant technical confluence zone at 94.96.
Imminent Buy Signal from Stochastic Oscillator?
The stochastic oscillator is currently positioned near the 40 level, indicating that a buy signal may be forthcoming. AUDJPY technical analysis shows that should the upside momentum we've seen in recent hours continue, the market may retest Friday's high of 95.54.
Potential Downside if 94.96 Level is Not Sustained
Failure to maintain price levels above 94.96 could trigger a move towards the next technical confluence area, which ranges between 96.65 and 94.70. Such a development would indicate bearish sentiment on both the 4-hour and daily timeframes and could herald further weakening in the AUDJPY market.
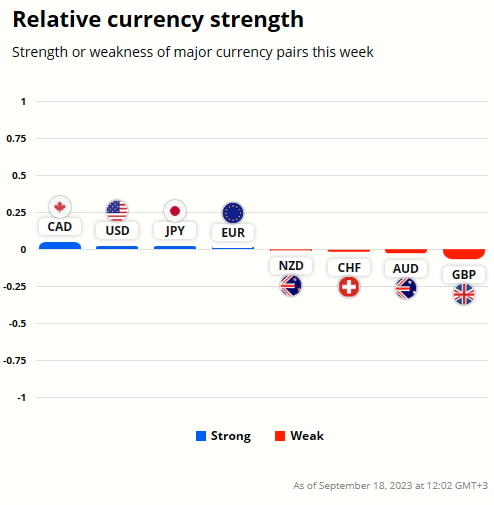
JPY and AUD currency strength analysis
As it's still early in the week the usual graph that tracks the changes for the week ongoing doesn't show much change in the currencies yet. However, if we look at the weekly (5 trading days) change in AUD and JPY the AUD is significantly stronger than the JPY. Use our AUDJPY technical analysis to navigate the market today.
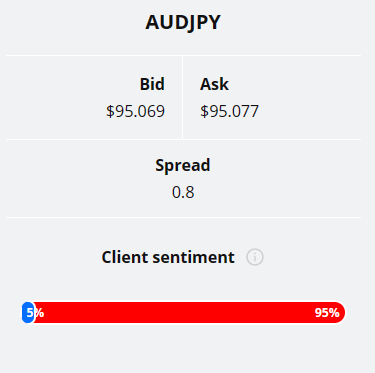
95% of TIOmarkets' clients are bearish on the AUDJPY currency pair. Only 5% of the client base is holding long positions in this currency pair.
Please remember that the retail trader client sentiment is a contrarian indicator as most of the retail traders are on average betting against the market trends. This is why, experienced traders tend to trade against the retail client sentiment. You can follow the TIOmarkets client sentiment live on our Forex dashboard.
The key findings of the AUDJPY technical analysis:
- AUDJPY is trading at a critical juncture today, characterised by a confluence of significant technical indicators. The 23.6% Fibonacci retracement level, the lower boundary of the minor 4-hour bullish channel, and the SMA(20) are all closely aligned, collectively forming a technical convergence zone around the 94.96 level.
- A shooting star candlestick pattern on the daily chart signals a potential bearish reversal, suggesting that the market may be losing momentum.
- The market is trending higher on the daily timeframe, but has lost momentum and may retract some of its earlier gains.

The next main risk events
- AUD - Monetary Policy Meeting Minutes
- CAD - Consumer Price Index (CPI)
- CAD - Median CPI
- CAD - Trimmed CPI
- CAD - Common CPI
- USD - Building Permits
- CNY - 1-Year Loan Prime Rate
- CNY - 5-Year Loan Prime Rate
- GBP - Consumer Price Index (CPI)
- USD - Federal Funds Rate
- USD - FOMC Economic Projections
- USD - FOMC Statement
- USD - FOMC Press Conference
For more information and details see the TIOmarkets economic calendar.
While research has been undertaken to compile the above content, it remains an informational and educational piece only. None of the content provided constitutes any form of investment advice.
Tio Markets UK Limited is a company registered in England and Wales under company number 06592025 and is authorised and regulated by the Financial Conduct Authority FRN: 488900
Risk warning: CFDs are complex instruments and come with a high risk of losing money rapidly due to leverage. 82% of retail investor accounts lose money when trading CFDs with this provider. You should consider whether you understand how CFDs work and whether you can afford to take the high risk of losing your money. Professional clients can lose more than they deposit. All trading involves risk.
DISCLAIMER: Tio Markets offers an exclusively execution-only service. The views expressed are for information purposes only. None of the content provided constitutes any form of investment advice. The comments are made available purely for educational and marketing purposes and do NOT constitute advice or investment recommendation (and should not be considered as such) and do not in any way constitute an invitation to acquire any financial instrument or product. TIOmarkets and its affiliates and consultants are not liable for any damages that may be caused by individual comments or statements by TIOmarkets analysis and assumes no liability with respect to the completeness and correctness of the content presented. The investor is solely responsible for the risk of his/her investment decisions. The analyses and comments presented do not include any consideration of your personal investment objectives, financial circumstances, or needs. The content has not been prepared in accordance with any legal requirements for financial analysis and must, therefore, be viewed by the reader as marketing information. TIOmarkets prohibits duplication or publication without explicit approval.

Janne Muta holds an M.Sc in finance and has over 20 years experience in analysing and trading the financial markets.
