Risk disclaimer: 76% of retail investor accounts lose money when trading CFDs and Spreadbets with this provider. You should consider whether you understand how CFDs and Spreadbets work and whether you can afford to take the high risk of losing your money.
USDJPY Technical Analysis | Market Approaches 12 Month Highs
BY Janne Muta
|October 26, 2023USDJPY Technical Analysis - The resilience of the US economy has been supporting the dollar against the Yen. As a result, the USDJPY pair has steadily moved higher and is about to reach the October 2022 high at 151.94. JPY's weakness against the dollar has stirred speculations of a possible intervention from the Bank of Japan.
Tomorrow's PCE Data Release
Tomorrow's PCE data release from the US will be closely watched by traders as a higher-than-expected PCE reading would be likely to increase expectations that the Federal Reserve might adopt a more hawkish stance, either by raising interest rates or signalling such intentions in the near future.
Higher interest rates in the U.S. or even the anticipation of them can attract foreign capital inflows, leading to an appreciation of the USD.
Read the full USDJPY Technical Analysis report below.
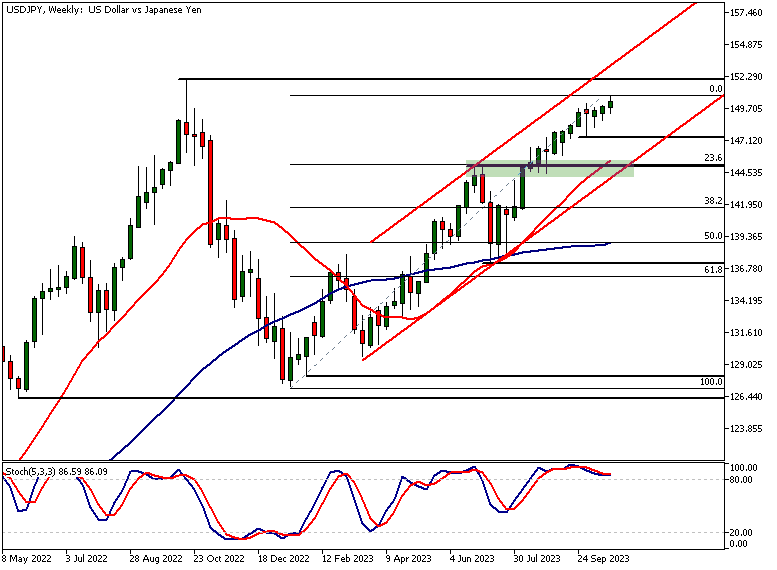
USDJPY Technical Analysis, Weekly Chart
The weekly trend is up with the SMAs in the bullish order. The SMA(20) is above the SMA(50) and pointing higher.
Oscillator & Momentum Loss
The market is approaching the October 2022 high (151.94) and the stochastic oscillator is overbought. The oscillator is indicating that the market is losing momentum despite the fact that over the last fifteen weeks, there have been only three weekly closes below the opening levels on those weeks. The momentum loss is not surprising given the fact that the market is now trading only about 1% away from the October 2022 high.
Market Correction Levels
If the market corrects lower, the nearest weekly key support level is at 147.42 while the nearest technical confluence level is at 145.00. This is where the 23.6% Fibonacci retracement level and the SMA(20) coincide with a market structure level (a swing high from June this year) and with the bullish trend channel low.
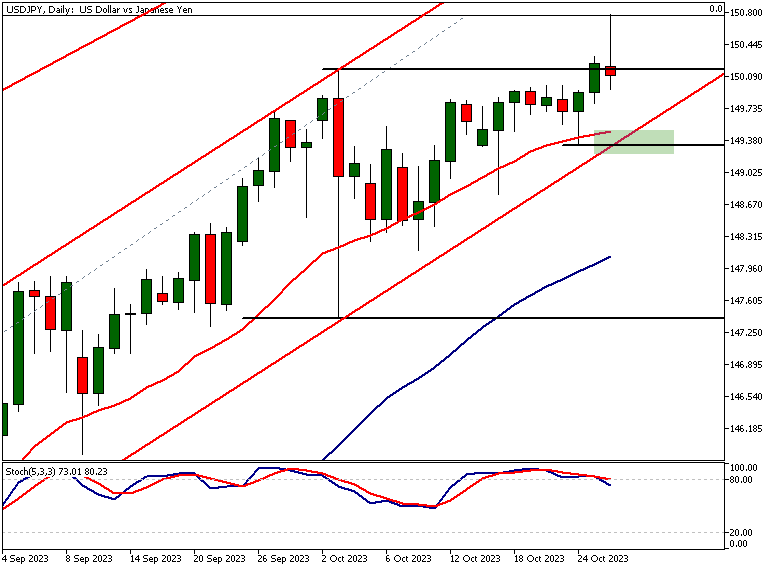
USDJPY Technical Analysis, Daily Chart
Our daily USDJPY technical analysis reveals another bullish channel within the wider weekly trend channel. This channel has been defining the recent daily timeframe rally since August. Today the market has been trying to break above the October 3rd high (150.16) but at the time of writing this the ground gained earlier has been lost. The market has retraced back to the 150.16 market structure level.
Nearest Confluence Area
The nearest confluence area is at 149.33 - 149.48. The SMA(20), the bull channel low, and a swing low are closely aligned inside this range.
Momentum & Market Targets
If the upside momentum continues to dominate in USDJPY, look for a move to the October 2022 high (151.94) we referred to in our weekly USDJPY technical analysis above. Alternatively, if the market breaks below the smaller bull channel low (currently at 149.38), we might see the market trading down to the SMA(50) at 148.09.
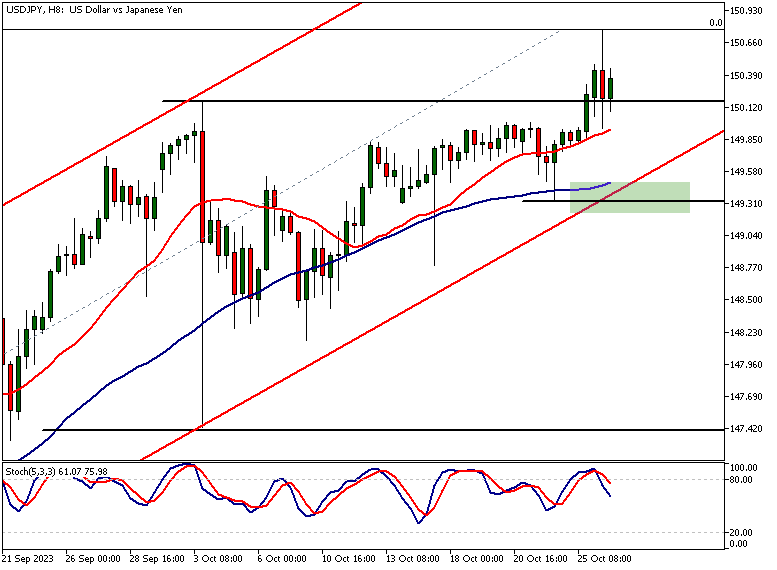
USDJPY Technical Analysis, 8h Chart
In the 8h timeframe, USDJPY has created a bearish candle with a long wick to the upside. This indicates weakness and we could see the market trading lower towards the confluence area we mentioned in the daily USDJPY technical analysis.
Potential Market Moves
If the market attracts buyers above 149.32, the uptrend stays in force and we could see the market trading higher. A break below this level would indicate weakness and might move the market down to 148.09 or so.

Client sentiment analysis
TIOmarkets clients are bearish on USDJPY with 82% of clients holding short positions and 18% holding long positions in the market.
Please remember that the retail trader client sentiment is a contrarian indicator as most of the retail traders are on average betting against the market trends. This is why, experienced traders tend to trade against the retail client sentiment. You can follow the TIOmarkets client sentiment live on our Forex dashboard.

While research has been undertaken to compile the above content, it remains an informational and educational piece only. None of the content provided constitutes any form of investment advice.
Tio Markets UK Limited is a company registered in England and Wales under company number 06592025 and is authorised and regulated by the Financial Conduct Authority FRN: 488900
Risk warning: CFDs are complex instruments and come with a high risk of losing money rapidly due to leverage. 82% of retail investor accounts lose money when trading CFDs with this provider. You should consider whether you understand how CFDs work and whether you can afford to take the high risk of losing your money. Professional clients can lose more than they deposit. All trading involves risk.
DISCLAIMER: Tio Markets offers an exclusively execution-only service. The views expressed are for information purposes only. None of the content provided constitutes any form of investment advice. The comments are made available purely for educational and marketing purposes and do NOT constitute advice or investment recommendation (and should not be considered as such) and do not in any way constitute an invitation to acquire any financial instrument or product. TIOmarkets and its affiliates and consultants are not liable for any damages that may be caused by individual comments or statements by TIOmarkets analysis and assumes no liability with respect to the completeness and correctness of the content presented. The investor is solely responsible for the risk of his/her investment decisions. The analyses and comments presented do not include any consideration of your personal investment objectives, financial circumstances, or needs. The content has not been prepared in accordance with any legal requirements for financial analysis and must, therefore, be viewed by the reader as marketing information. TIOmarkets prohibits duplication or publication without explicit approval.

Janne Muta holds an M.Sc in finance and has over 20 years experience in analysing and trading the financial markets.
