Risk disclaimer: 76% of retail investor accounts lose money when trading CFDs and Spreadbets with this provider. You should consider whether you understand how CFDs and Spreadbets work and whether you can afford to take the high risk of losing your money.
USDCHF Aanlysis | Fed Confident in Inflation Moderation
BY Janne Muta
|December 4, 2023USDCHF Analysis - The decline in USDCHF over the last four weeks has been driven by easing inflation and increased expectations that the Federal Reserve will cut rates several times next year. The bond market is moving higher, and as the Wall Street Journal notes, the yield on the 10-year Treasury note continued its downward trend for the third straight day.
This is its lowest point since September, representing a sharp drop from about a month ago when the yield on government bonds reached 5%, a peak not seen in 16 years.
Federal Reserve Governor Christopher Waller recently suggested extending the pause in rate increases into early next year, citing a slowdown in the economy and a decline in inflation. This dovish outlook was echoed by Governor Bowman, who emphasized prioritizing economic growth and employment over low inflation.
As of today's data, Fed Funds Futures traders are pricing in two more rate cuts for 2024. The Federal Reserve is expected to cut rates six times in total before the end of next year, starting in May. Currently, futures traders assign a 76% probability that the first 25 basis point rate cut will occur in May 2024.
Summary of This USDCHF Analysis Report:
- Currently, it is the downside momentum that dominates the weekly chart. Therefore, it might be too early to anticipate a market reversal. However, should there be a contra-trend rally, the key resistance level of 0.8888 might be targeted by traders.
- The daily chart shows that the market has traded close to a key market structure level (support level) at 0.8700. This level was formed in July, first acting as resistance and then as support, propelling the market to a strong move higher. Today the market has been trading higher, suggesting that some traders view the current levels as deeply oversold.
- USDCHF trades inside a bearish trend channel, with the nearest key resistance level at 0.8784. This level coincides with the 50-period moving average and the bear channel top, making it a potential target area for intraday traders (long) and a potential entry level for those looking to short the market. The market remains bearish as per indicator-based USDCHF analysis, with the 20-period SMA below the 50-period SMA.
Read the full USDCHF analysis report below.
USDCHF Analysis
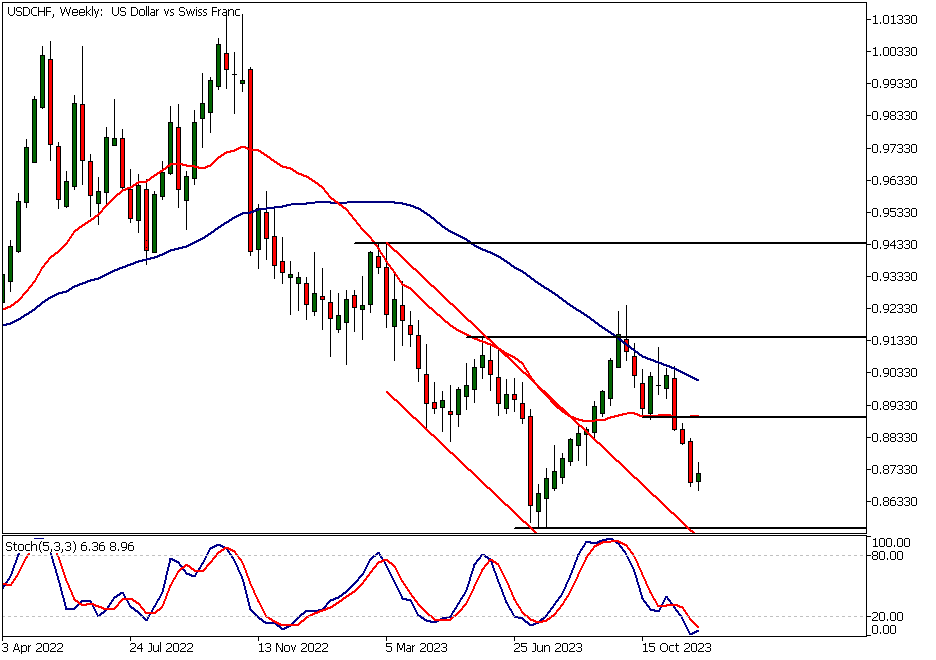
Weekly USDCHF analysis
The stochastic oscillator is in the oversold area, and the moving averages are bearish, with the 20-period moving average positioned below the 50-period SMA. This indicates that the market is currently bearish according to our USDCHF analysis.
Major support level only 1.5% away
Note, however, that the USDCHF has been trading lower for three consecutive weeks, bringing the market within 1.5% of a major support level, the July low at 0.8554. Although the market remains bearish, it could soon reach levels where the immediate downside may become limited.
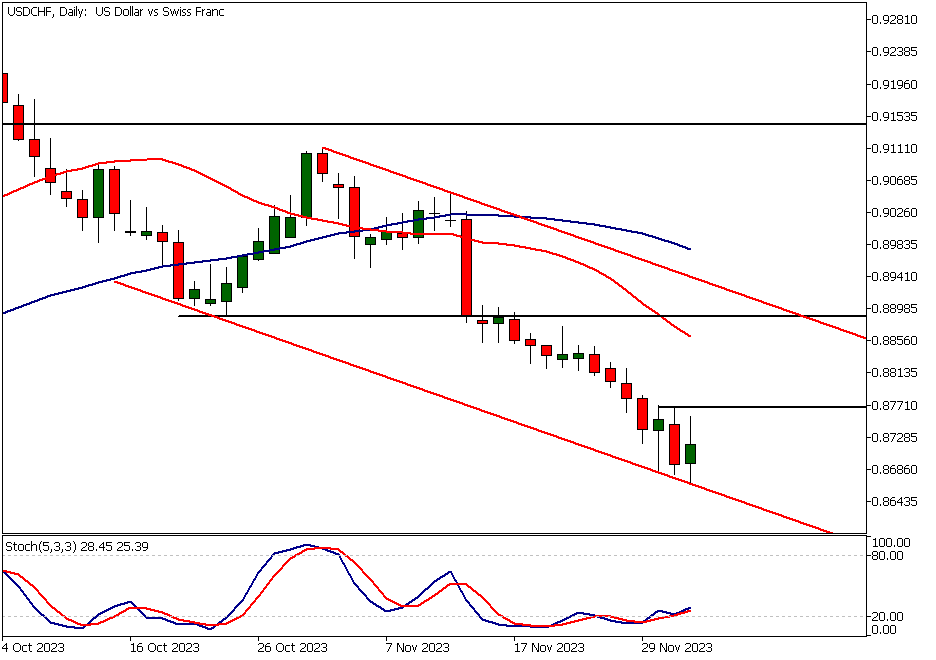
Daily USDCHF analysis
On the daily chart, USDCHF is trading close to the lower boundary of a descending trend channel, with the moving averages indicating a downward trajectory. However, the stochastic oscillator is rising from the oversold area.
Divergence indication
This divergence suggests that while the market is trending lower, it could be oversold at current levels. This could lead to a counter-trend rally. However, for the rally to take place the market needs to break above the 0.8768 resistance level. USDCHF analysis indicates that above this level, a rally up to 0.8820 could occur. Alternatively, a move down to 0.8640 could be likely.

USDCHF analysis, 2h Chart
The 2-hour chart shows increased market volatility in recent days, which might indicate that the downtrend is maturing. These are just early indications and as such should not be taken as a prediction that the market is now likely to reverse the downtrend and move higher. The moving averages are still pointing lower, and the market trades below the 50-period moving average.
Breakout needed for a sustained rally
But, if there is a decisive rally above the 0.8640 resistance level, a more sustained counter-trend rally could be possible. If the market rallies above this level, follow the price action in minor timeframes to determine if a sustained uptrend can form. Otherwise, USDCHF analysis shows, the risk of the market trending lower remains considerable.
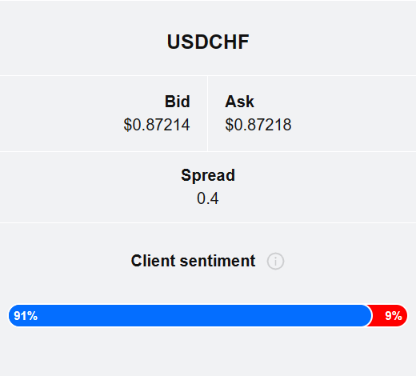
Client sentiment analysis
TIOmarkets' clients are extremely bullish on USDCHF with 91% of them currently holding long positions in the market, while 9% of them are short the market.
Please remember that the retail trader client sentiment is a contrarian indicator as most of the retail traders are on average betting against the market trends. This is why, experienced traders tend to trade against the retail client sentiment. You can follow the TIOmarkets client sentiment live on our Forex dashboard.
The key risk events impacting this market today
- USD - ISM Services PMI
- USD - JOLTS Job Openings
- USD - ADP Non-Farm Employment Change
- CHF - Foreign Currency Reserves
- USD - Unemployment Claims
- USD - Average Hourly Earnings
- USD - Non-Farm Employment Change
- USD - Unemployment Rate
- USD - Prelim UoM Consumer Sentiment
- USD - Prelim UoM Inflation Expectations

Potential USDCHF Market Moves
On the daily chart, USDCHF is trading close to the lower boundary of a descending trend channel, with the moving averages indicating a downward trajectory. However, the stochastic oscillator is rising from the oversold area.
This divergence suggests that while the market is trending lower, it could be oversold at current levels. This could lead to a counter-trend rally. For a more decisive rally, the market needs to break above the 0.8768 resistance level. Above this level, a rally up to 0.8820 could occur. Alternatively, a move down to 0.8640 could be likely.
How would you trade the USDCHF today?
I hope this fundamental and technical USDCHF analysis helps you to make better informed trading decisions. Check the latest market analysis for other instruments and subscribe to receive them in your inbox as soon as they are published.
While research has been undertaken to compile the above content, it remains an informational and educational piece only. None of the content provided constitutes any form of investment advice.
TIO Markets UK Limited is a company registered in England and Wales under company number 06592025 and is authorised and regulated by the Financial Conduct Authority FRN: 488900
Risk warning: CFDs are complex instruments and come with a high risk of losing money rapidly due to leverage. 73% of retail investor accounts lose money when trading CFDs with this provider. You should consider whether you understand how CFDs work and whether you can afford to take the high risk of losing your money. Professional clients can lose more than they deposit. All trading involves risk.
DISCLAIMER: TIO Markets offers an exclusively execution-only service. The views expressed are for information purposes only. None of the content provided constitutes any form of investment advice. The comments are made available purely for educational and marketing purposes and do NOT constitute advice or investment recommendation (and should not be considered as such) and do not in any way constitute an invitation to acquire any financial instrument or product. TIOmarkets and its affiliates and consultants are not liable for any damages that may be caused by individual comments or statements by TIOmarkets analysis and assumes no liability with respect to the completeness and correctness of the content presented. The investor is solely responsible for the risk of his/her investment decisions. The analyses and comments presented do not include any consideration of your personal investment objectives, financial circumstances, or needs. The content has not been prepared in accordance with any legal requirements for financial analysis and must, therefore, be viewed by the reader as marketing information. TIOmarkets prohibits duplication or publication without explicit approval.

Janne Muta holds an M.Sc in finance and has over 20 years experience in analysing and trading the financial markets.
