Risk disclaimer: 76% of retail investor accounts lose money when trading CFDs and Spreadbets with this provider. You should consider whether you understand how CFDs and Spreadbets work and whether you can afford to take the high risk of losing your money.
USDCAD Analysis | Lower oil and strong USD weigh on CAD
BY Janne Muta
|December 6, 2023USDCAD Analysis - The CAD has weakened against the USD, due to dollar strength and a 4% drop in oil prices this week, despite OPEC+'s efforts to stabilize prices through production cuts. Canada's most crucial export, oil, remains under pressure as shale production continues to exert a significant influence on the oil market.
According to Reuters, efficiency improvements in the U.S. shale industry enable it to sustain output growth even in the face of falling oil prices and a reduction in the number of drilling rigs. Consequently, this has led to record-high US oil production, which is further straining prices.
Looking toward the long term, the global oil market is anticipated to undergo significant changes driven by policies supporting electrification and a reduction in oil demand from the transportation sector. This sector, constituting roughly 60% of global oil demand, is projected to decline as electric vehicles (EVs) become more prevalent, potentially reducing oil demand by 5 million barrels per day by 2030.
Major oil companies and governments in the largest oil-consuming countries, such as the US and China, have adjusted their oil demand forecasts accordingly.
BoC interest rate decision is due today. In its October 2023 meeting, the Bank of Canada kept the overnight rate steady at 5%, maintaining high borrowing costs for the 22nd consecutive year. This decision, in line with expectations, reflects the central bank's cautious stance amid recent economic data.
Past rate hikes have curbed economic activity and price growth, prompting a pause in tightening. Inflation has slowed, GDP growth and retail sales have stalled, and the bank anticipates inflation volatility before returning to 2% by 2025, considering elevated energy prices and wage growth as potential upside risks. The central bank is expected to leave the rates untouched.
Summary of this USDCAD analysis report
- USDCAD has risen by almost 0.80% from this week's low as the dollar index strengthens, while the price of oil trades lower by 4%. According to technical USDCAD analysis, the upside potential could be limited by the market structure area at 1.3629 - 1.3654.
- In the 8-hour chart, USDCAD has lost some of its upside momentum, with the market forming two inside candles below the high of 1.3594. The stochastic oscillator has given a sell signal while in the overbought area (above 80). If the market cannot exceed 1.3594, USDCAD could trade down to 1.3530.
- The CAD has weakened against the USD, due to dollar strength and a 4% drop in oil prices this week, despite OPEC+'s efforts to stabilize prices through production cuts. Canada's most crucial export, oil, remains under pressure as shale production continues to exert a significant influence on the oil market.
Read our full USDCAD analysis report below.
USDCAD Analysis

USDCAD Analysis, Weekly
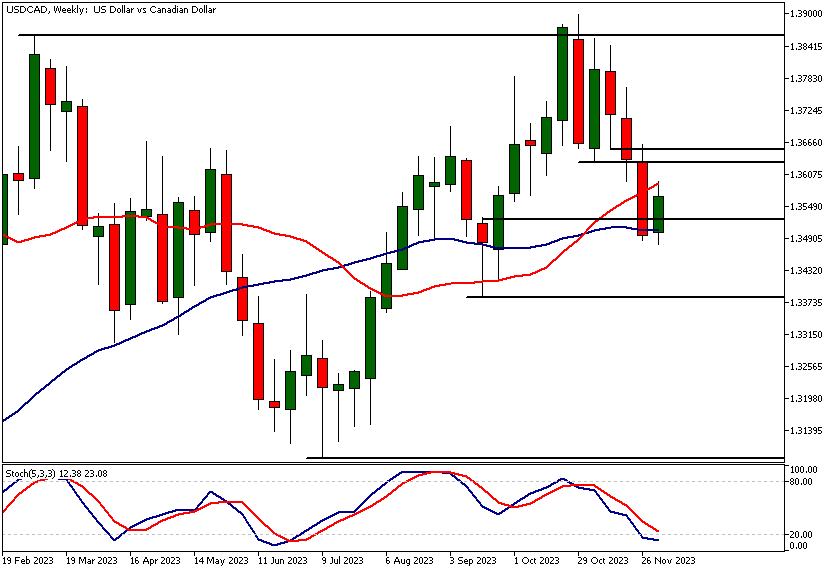
USDCAD has risen by almost 0.80% from this week's low as the dollar index strengthens, while the price of oil trades lower by 4%. According to technical USDCAD analysis, the upside potential could be limited by the market structure area at 1.3629 - 1.3654. Below this price range, a move to 1.3408 seems likely, while above it, USDCAD might be able to rally to 1.3710.
Indicator-based USDCAD analysis suggests that the market is oversold, with the stochastic oscillator currently at 12.84. The moving averages indicate slight bullishness, but the nearby market structure area at 1.3629 - 1.3654 could limit the upside potential.

USDCAD Analysis, Daily
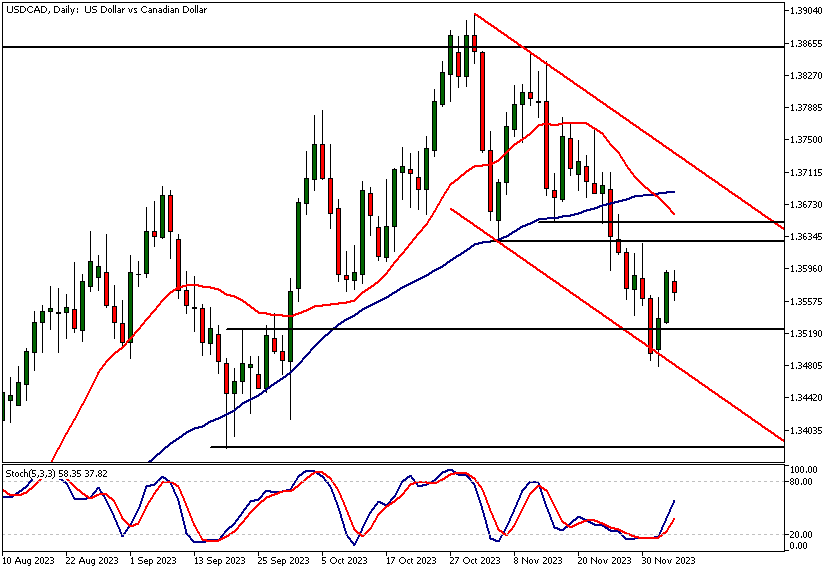
USDCAD rallied higher after trading down to a bottoming pattern that it had created in September. The exact reversal point was the low of the descending trend channel highlighted in the previous USDCAD analysis report. The market remains in a downtrend, so the current rally is, by definition, a counter-trend rally that could eventually lose momentum.
It is typical for markets, even in trending environments, to exhibit a certain amount of mean reversion behaviour. Therefore, when a market becomes overextended in the trend direction, it is likely to pull back, which is exactly what has happened now. However, these counter-trend moves often fail to create a new lasting uptrend.
The key price levels
Therefore, we should monitor price action in USD CAD to see if the current move reverses at key resistance levels. The nearest key resistance area in the daily chart is the market structure area at 1.3629 - 1.3654. Note how the 20-period moving average is relatively closely aligned with the upper end of this range.
If the market rallies into this range, traders should keep a close eye on price action in lower timeframes to see if the market exhibits signs of renewed selling taking place. This could signal that the market is ready to resume its downtrend.

USDCAD Analysis, 8h
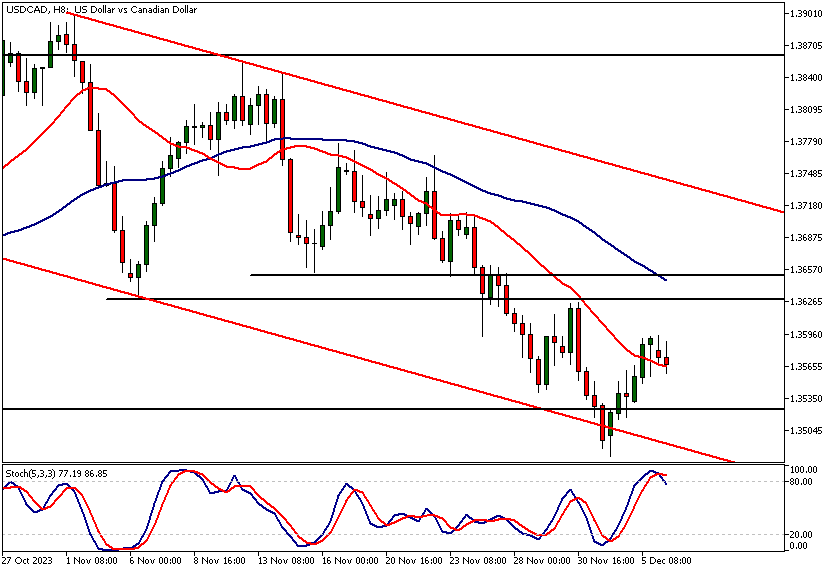
In the 8-hour chart, USDCAD has lost some of its upside momentum, with the market forming two inside candles below the high of 1.3594. The stochastic oscillator has given a sell signal while in the overbought area (above 80). If the market cannot exceed 1.3594, USDCAD could trade down to 1.3530.
Alternatively, if it rises above 1.3594, look for a move to 1.3626. Moving average-based USDCAD analysis shows the market in a downtrend, with the moving averages pointing lower and the 20-period moving average below the 50-period SMA.

Client sentiment analysis
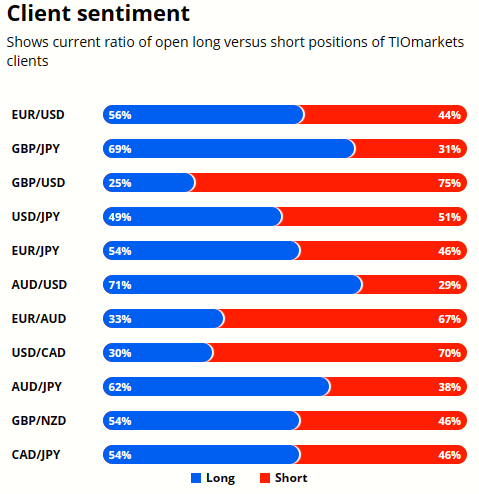
TIOmarkets clients are bearish with 70% short USDCAD and 30% long the market.
Please remember that the retail trader client sentiment is a contrarian indicator as most of the retail traders are on average betting against the market trends. This is why, experienced traders tend to trade against the retail client sentiment. You can follow the TIOmarkets client sentiment live on our Forex dashboard.
The Next Key Risk Events
- CAD - BOC Rate Statement
- CAD - Overnight Rate
- CAD - Ivey PMI
- USD - Unemployment Claims
- USD - Average Hourly Earnings m/m
- USD - Non-Farm Employment Change
- USD - Unemployment Rate
- USD - Prelim UoM Consumer Sentiment
- USD - Prelim UoM Inflation Expectations
Potential USDCAD market moves
In the 8-hour chart, USDCAD has lost some of its upside momentum, with the market forming two inside candles below the high of 1.3594. The stochastic oscillator has given a sell signal while in the overbought area (above 80). If the market cannot exceed 1.3594, USDCAD could trade down to 1.3530.

How would you trade USDCAD today?
I hope this fundamental and technical USDCAD analysis helps you make better informed trading decisions. Check the latest market analysis for other instruments and subscribe to receive them in your inbox as soon as they are published
While research has been undertaken to compile the above content, it remains an informational and educational piece only. None of the content provided constitutes any form of investment advice.
TIO Markets UK Limited is a company registered in England and Wales under company number 06592025 and is authorised and regulated by the Financial Conduct Authority FRN: 488900
Risk warning: CFDs are complex instruments and come with a high risk of losing money rapidly due to leverage. 73% of retail investor accounts lose money when trading CFDs with this provider. You should consider whether you understand how CFDs work and whether you can afford to take the high risk of losing your money. Professional clients can lose more than they deposit. All trading involves risk.
DISCLAIMER: TIO Markets offers an exclusively execution-only service. The views expressed are for information purposes only. None of the content provided constitutes any form of investment advice. The comments are made available purely for educational and marketing purposes and do NOT constitute advice or investment recommendation (and should not be considered as such) and do not in any way constitute an invitation to acquire any financial instrument or product. TIOmarkets and its affiliates and consultants are not liable for any damages that may be caused by individual comments or statements by TIOmarkets analysis and assumes no liability with respect to the completeness and correctness of the content presented. The investor is solely responsible for the risk of his/her investment decisions. The analyses and comments presented do not include any consideration of your personal investment objectives, financial circumstances, or needs. The content has not been prepared in accordance with any legal requirements for financial analysis and must, therefore, be viewed by the reader as marketing information. TIOmarkets prohibits duplication or publication without explicit approval.

Janne Muta holds an M.Sc in finance and has over 20 years experience in analysing and trading the financial markets.
