Risk disclaimer: 76% of retail investor accounts lose money when trading CFDs and Spreadbets with this provider. You should consider whether you understand how CFDs and Spreadbets work and whether you can afford to take the high risk of losing your money.
SP 500 technical analysis | All S&P 500 sectors rallied after Powell's Speech
BY Janne Muta
|August 28, 2023While S&P 500 technical analysis is the focus of this analysis we will also cover some fundamentals. Fed talk, inflation and consumer spending trends remain at the centre of market analysis in top S&P 500 technical analysis when considering the likely path for the equities markets.
In his Jackson Hole speech on Friday, Federal Reserve Chair Jerome Powell said the central bank would “proceed carefully” on any further rate increases. Investors are split over whether there will be more rate increases. Interest rates are at a 22-year high after the Fed lifted them again last month. Stocks moved between gains and losses after Powell’s speech, before closing higher.
Investors have worried that elevated interest rates were starting to weigh on consumer spending. Elevated rates have helped to curtail inflation, which has retreated from the 40-year high it hit last summer. Consumer spending shows mixed signals: Personal Consumption Expenditure (PCE) grew at a slower rate of 1.6%, indicating caution.
However, retail sales rose 0.7% in July, suggesting consumer resilience in certain sectors. Inflation shows signs of easing, but the Federal Reserve may still raise interest rates, warranting caution amid a complex economic landscape.
The Federal Reserve faces a delicate balancing act: it aims to slow down hiring, investment, and spending to curb inflation without causing a harsh economic slowdown. Opinions among Fed Funds Futures traders are split on future rate hikes, though the likelihood of another increase this year has marginally risen.
The next key risk events for this market are S&P/CS Composite-20 HPI and CB Consumer Confidence and the JOLTS Job Openings on Tuesday.
S&P 500 technical analysis

S&P 500 weekly chart analysis
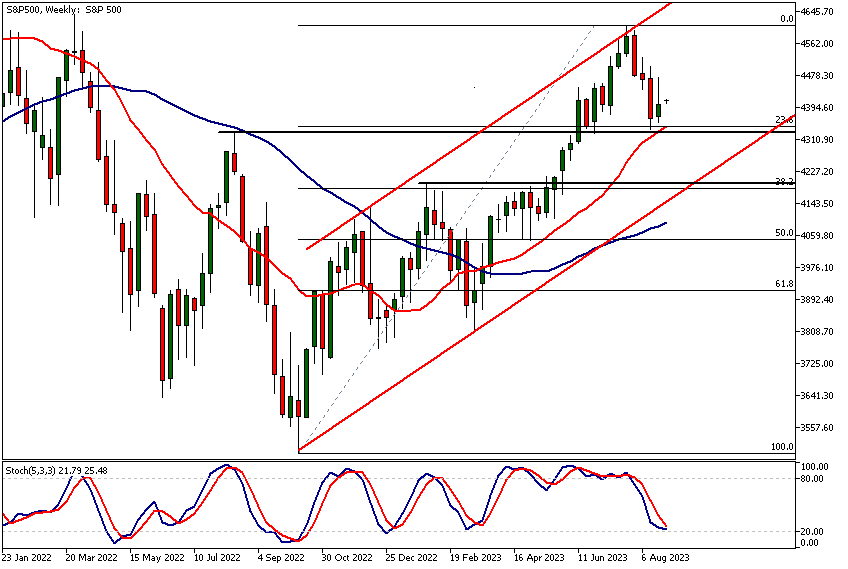
After rallying 22% since the March low the market has over the past 4 weeks retraced some of the move. Interestingly it was a technical confluence area between 4316 and 4345 that provided support to the market. Several technical factors coincide in this support range. We have the 23.8% Fibonacci retracement level at 4345 roughly coinciding with the August 14th 2022 high at 4325 and the SMA(20) at 4316.
The reason technical confluence levels work is that they increase the number of people focusing on the same price level. While some are mainly following moving averages and others market structure there are those that focus on Fibonacci retracement levels. The larger the number of technical factors the bigger the crowd of people focusing on the price range they coincide in.
This increases the probability of a market reaction inside the confluence area. Last week the market moved higher from this level, making it the first positive week of trading in the S&P 500 since the end of July.
Stochastic Oscillator near to the oversold territory
The Stochastics Oscillator (5.3.3) is near to the oversold levels (currently at 21.07) which in the current context is a bullish indication. As you can see from the chart, since the S&P 500 started creating higher lows the 5.3.3 settings in the Stochastics Oscillator have given clear and reliable indications on the market forming a local low.
While this is never a guarantee that the indication will be 100% reliable in the future, it makes sense to incorporate the oscillator into the analysis as one of the factors highlighting a potential trading opportunity.
The price is the most important indicator
Note, that even though S&P 500 technical analysis often focuses on indicators the most important technical indicator is the price itself. What the price does on a day-to-day and hour-to-hour basis, trumps all the other indications as it represents the collective opinion of all the market participants on the correct market price.
S&P 500 was trending higher in a narrower trend channel until the rally failed at the wider channel top. Now this accelerated uptrend isn’t in force anymore and the market could be more vulnerable. If the weakness continues and the 4316 - 4345 confluence area gives in the market might eventually move to the next major confluence area at 4153 – 4195. The current channel low, the 38.2% Fibonacci retracement level and a market structure level (January 2023 high) coincide.
On the other hand, if last week’s upmove from the 4316 - 4345 confluence area is indicative of further upside movement, the market could attempt to resume the uptrend.

S&P 500 daily chart analysis
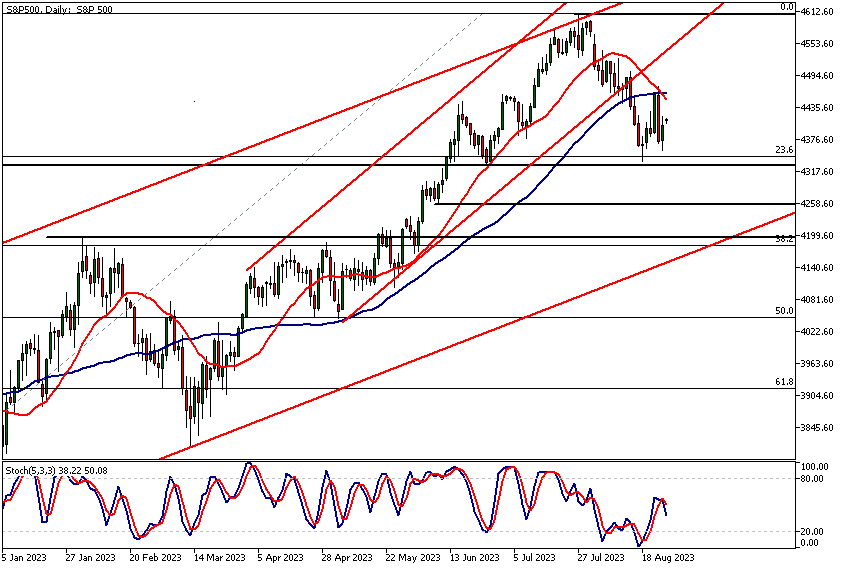
While Thursday was a bearish engulfing day, Friday’s rally and a higher low in the daily chart suggest there’s some optimism in the bull camp. The fact that traders are willing to bid the market at higher prices is a positive factor, but as always, there needs to be follow-through buying.
What happens today and tomorrow is therefore quite important. If we get a decisive rally that challenges Friday’s high (4473) successfully and moves the market beyond the level with strength last week’s sideways move could turn into a base from which the next leg in the rally could potentially develop. This could lead to the market rallying to 4580 or so.
If 4473 can’t be penetrated (failed breakouts don’t count) look for the market to break below last week’s low. In this scenario, the S&P 500 technical analysis points to the next daily support below last week’s low is at 4256. That’s a minor support level though and we might see further deterioration to the next major weekly support level 4195.

S&P 500 1h chart analysis
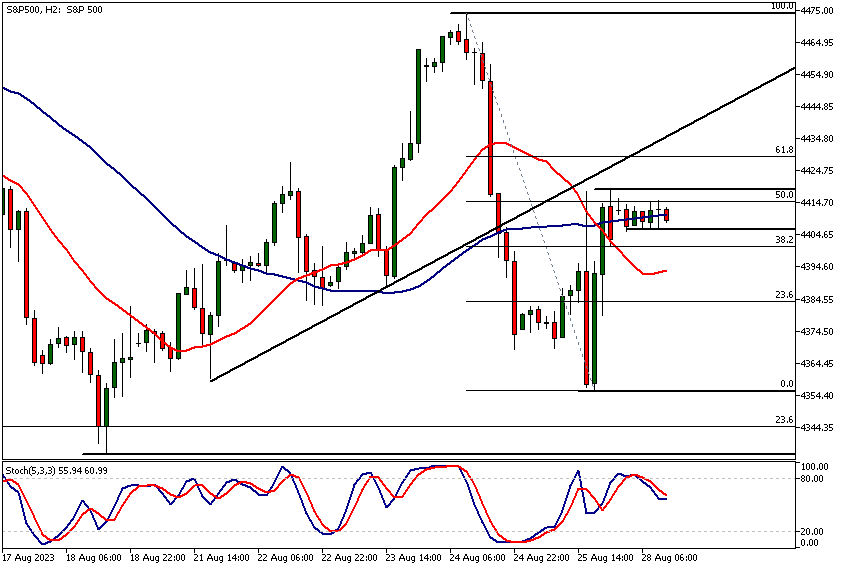
The bulls started buying couple of hours after the market open on Friday and pushed the market sharply higher intraday. As a result the market created an 8h bullish hammer candle in the New York cash session on Friday.
The hourly chart shows better where the rally started. Now S&P 500 is stuck in a trading range (4410 - 4419) with the London market closed and the calendar void of major risk events. If the upper end of the range is violated, look for a move to 4435 and then possibly to 4450 intraday. If the range low breaks the market could test Friday's low (4355) again.
The sectors that rallied the most were the consumer discretionary (1.12%), the technology (1.02%) and the energy (0.97%) sectors. All eleven sectors finished the day on the green. This indicates that investors felt positive after the Jackson Hole speech but it is important to see follow through buying to confirm the indications in the sector strength.

Client sentiment analysis
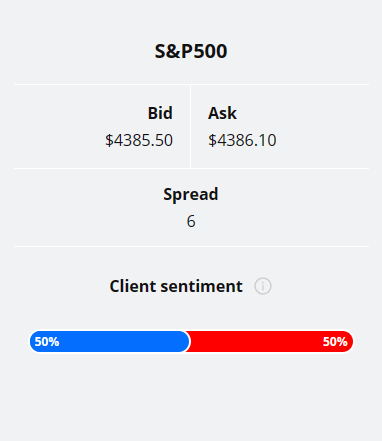
TIOmarkets' clients are positioned evenly in the S&P 500. There is therefore no indication to either direction on client sentiment in this market. It’s good to remember that the retail trader client sentiment is a contrarian indicator as most of the retail traders are on average betting against the market trends. This is why, experienced traders tend to trade against the retail client sentiment. You can follow the TIOmarkets client sentiment live on our Forex dashboard.
S&P 500 fundamental analysis
Another method that helps us to use S&P 500 technical analysis with added confidence is the analysis of macroeconomic fundamentals. The market reactions to the fundamentals not only provide us with knowledge of the actual macroeconomic conditions but also help us to gauge the market sentiment.
Consumer Resilience and Spending
Personal consumption expenditure (PCE), a key indicator of consumer spending, grew at an annualized rate of 1.6% in the first half of the year. This deceleration from the 4.2% rise in the previous period suggests that consumers may be adopting a more cautious approach. On a monthly basis, however, the PCE price index rose by 0.2% in June 2023, consistent with market expectations and slightly higher than the 0.1% rise in May. This modest increase could suggest a stabilization in consumer prices.
Retail Sales: The Silver Lining
While PCE growth has slowed, retail sales trends paint a different picture, showing an uptick in consumer resilience. Retail sales in July 2023 rose by 0.7% month-over-month, beating market forecasts and marking the fourth consecutive month of gains. This divergence between PCE and retail sales may indicate that while overall spending may be cautious, consumers are still willing to engage in retail consumption, affirming that strong consumer spending in some sectors has been a major contributor to economic growth outperforming expectations.
As we move further into the year, the slowing growth in PCE raises some concerns about the future pace of economic growth, particularly as excess savings get depleted and wage growth moderates. This is in line with the expectation that economic growth may experience a slowdown.
Recession Unlikely but Caution Advised
Inflation concerns persist but are showing signs of easing. Core PCE prices, a preferred metric for the Federal Reserve, increased by only 0.2% month-over-month in June 2023. The combination of easing inflation and strong retail sales suggests that a severe recession is not imminent, although the landscape is complex.
Caution is warranted, especially given the Federal Reserve's hints that it might still raise rates if necessary. While a rate hike could potentially slow down consumer spending, contributing to easing inflation pressures, it could also introduce new economic uncertainties. Thus, despite some positive signs, vigilance is advisable given the multifaceted economic landscape.
Combining Tools for a Strategic Edge
The fundamental trends in the economy and Fed policy dictate the institutional fund flows but it’s the S&P 500 technical analysis that allows traders to time the market with a greater efficiency. Thus combining the two approaches might give our readers the tools they need in building strategies and a better trading edge.

The Next Main Risk Events
- AUD - Retail Sales m/m
- AUD - RBA Gov-Designate Bullock Speaks
- USD - S&P/CS Composite-20 HPI y/y
- USD - CB Consumer Confidence
- USD - JOLTS Job Openings
- AUD - CPI y/y
- EUR - German Prelim CPI m/m
- EUR - Spanish Flash CPI y/y
- USD - ADP Non-Farm Employment Change
- USD - Prelim GDP q/q
- USD - Prelim GDP Price Index q/q
- USD Pending Home Sales m/m
For more information and details see the TIOmarkets economic calendar.
While research has been undertaken to compile the above content, it remains an informational and educational piece only. None of the content provided constitutes any form of investment advice.
Tio Markets UK Limited is a company registered in England and Wales under company number 06592025 and is authorised and regulated by the Financial Conduct Authority FRN: 488900
Risk warning: CFDs are complex instruments and come with a high risk of losing money rapidly due to leverage. 82% of retail investor accounts lose money when trading CFDs with this provider. You should consider whether you understand how CFDs work and whether you can afford to take the high risk of losing your money. Professional clients can lose more than they deposit. All trading involves risk.
DISCLAIMER: Tio Markets offers an exclusively execution-only service. The views expressed are for information purposes only. None of the content provided constitutes any form of investment advice. The comments are made available purely for educational and marketing purposes and do NOT constitute advice or investment recommendation (and should not be considered as such) and do not in any way constitute an invitation to acquire any financial instrument or product. TIOmarkets and its affiliates and consultants are not liable for any damages that may be caused by individual comments or statements by TIOmarkets analysis and assumes no liability with respect to the completeness and correctness of the content presented. The investor is solely responsible for the risk of his/her investment decisions. The analyses and comments presented do not include any consideration of your personal investment objectives, financial circumstances, or needs. The content has not been prepared in accordance with any legal requirements for financial analysis and must, therefore, be viewed by the reader as marketing information. TIOmarkets prohibits duplication or publication without explicit approval.

Janne Muta holds an M.Sc in finance and has over 20 years experience in analysing and trading the financial markets.
