Risk disclaimer: 76% of retail investor accounts lose money when trading CFDs and Spreadbets with this provider. You should consider whether you understand how CFDs and Spreadbets work and whether you can afford to take the high risk of losing your money.
Silver Technical Analysis | Lower US inflation could support Silver
BY Janne Muta
|January 29, 2024Silver Technical Analysis – The lower December inflation in the US has kept the possible Federal Reserve rate adjustments on everyone's radar. The Federal Reserve's preferred inflation measure, the personal consumption expenditures price index, recorded a moderate year-on-year increase of 2.6% in December, as per the Commerce Department. This is substantially lower than the 5.4% rise at 2022's end.
Consumer spending, a crucial driver of the US economy, rose robustly by 0.7% in December, signalling strong demand. This resilience is vital for the silver market due to its industrial applications.
Looking forward, forecasters remain optimistic about continued economic growth in 2024, despite the challenges of higher interest rates. The housing market, indicative of economic health, showed positive signs, with pending home sales increasing by 8.3% in December.
These trends, along with a robust labour market, controlled inflation, and steady wage growth, position the US economy well, diminishing earlier recession concerns. Such an economic environment is beneficial for the silver market, thriving on strong risk sentiment.
Furthermore, lower inflation expectations are likely to bolster Fed rate cut prospects, which in turn could pressure the dollar. A weaker dollar is expected to benefit the dollar-priced silver market. The more affordable silver becomes for investors using other currencies, the higher the demand.
Thus, the combination of a potentially weaker dollar and a stable economic outlook presents a favourable scenario for silver, both as an industrial metal and an investment commodity.
Summary of This Silver Technical Analysis Report:
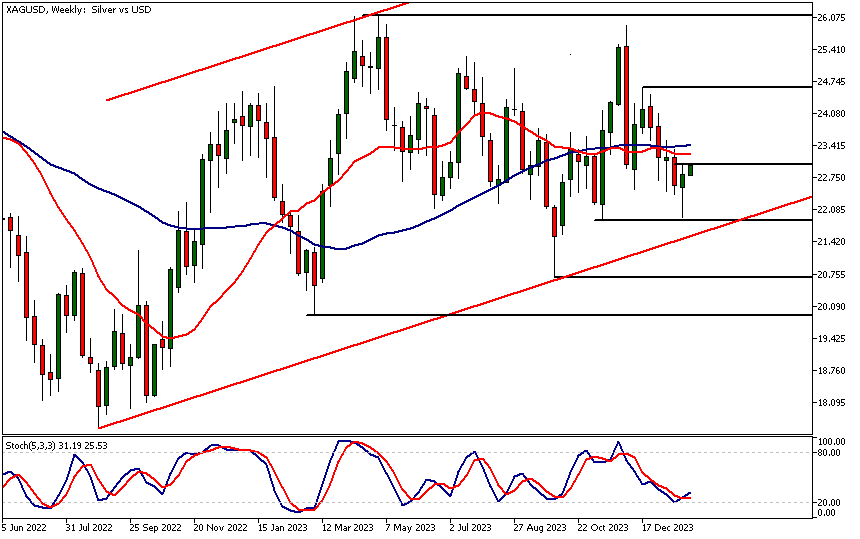
- The market created a strongly bullish candle last week, suggesting that higher prices could be in store for the silver market this week. However, the market needs to decisively break above last week's high at 23.02 first. Silver technical analysis indicates that this move could eventually take the market to 24.20.
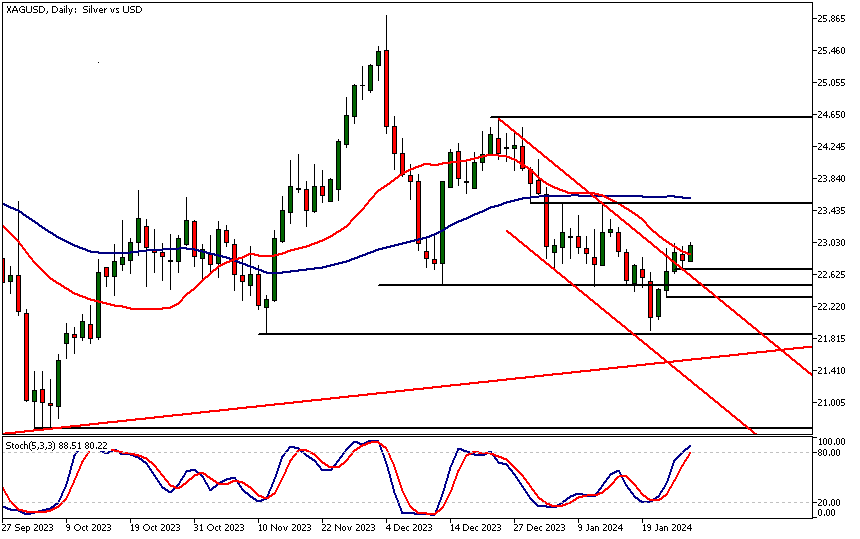
- Silver broke out of a bearish trend channel on Thursday last week. After some hesitation on Friday, the market seems to be continuing its rally today. The market could be heading higher, possibly reaching the 23.52 resistance level. Silver's technical analysis shows how this level is closely aligned with the 50-period moving average, suggesting that the general area could be targeted by short-term traders.
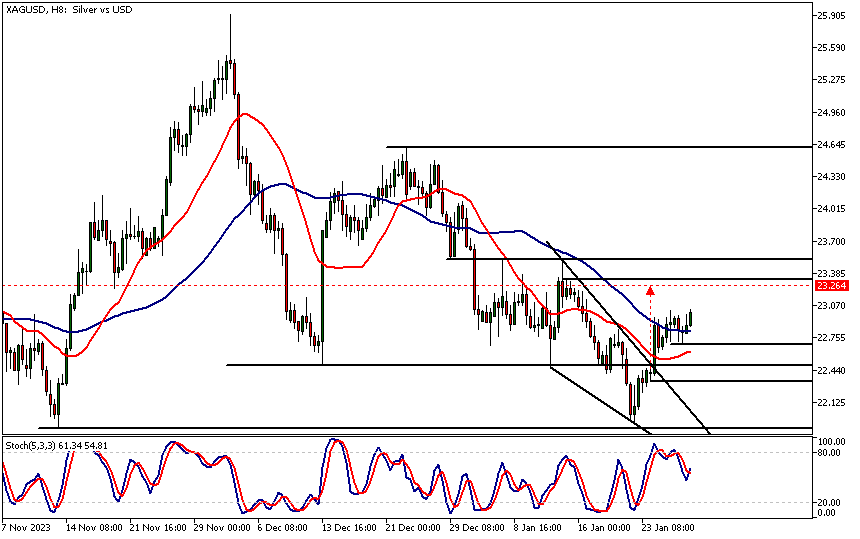
- The 8h chart shows how the market has created a higher reactionary low at 22.70 in after it broke out of the bullish wedge. The width of the wedge provides us with a measured move target at 23.26. Alternatively, if the market breaks below 22.70, we could see a move down to 22.46.
Read the full Silver technical analysis report below.
Silver Technical Analysis

Weekly Silver Technical Analysis
The market created a strongly bullish candle last week, suggesting that higher prices could be in store for the silver market this week. However, the market needs to decisively break above last week's high at 23.02 first. Silver technical analysis indicates that this move could eventually take the market to 24.20.
Alternatively, if the rally fails, look for a move down to 23.40. The stochastic oscillator has given a buy signal while very close to the oversold threshold of 20. With the market creating a bullish rejection candle last week, the stochastic oscillator buy signal seems genuine and valid.

Daily Silver Technical Analysis
Silver broke out of a bearish trend channel on Thursday last week. After some hesitation on Friday, the market seems to be continuing its rally today. The market could be heading higher, possibly reaching the 23.52 resistance level.
Silver technical analysis shows how this level is closely aligned with the 50-period moving average, suggesting that the general area could be targeted by short-term traders. Below the current market price, the channel top, currently at 22.56, could provide support to the market should there be a retracement lower.
The stochastic oscillator is in the overbought area, but that's due to the fast rally higher we saw last week. In this context, the overbought reading might not mean that much.

Intraday Silver Technical Analysis
The 8h chart shows how the market has created a higher reactionary low at 22.70 in after it broke out of the bullish wedge. The width of the wedge provides us with a measured move target at 23.26. The moving averages are still in a bearish order, with the 20-period moving average below the 50-period SMA.
However, that's due to the slowness of the moving averages; they haven't yet adjusted to the strong up move last week. Most importantly, silver technical analysis shows the market is trading above the 20-period moving average, and the SMA 20 is pointing higher, suggesting it could be crossing above the 50-period fairly soon.
Alternatively, if the market breaks below 22.70, we could see a move down to 22.46.

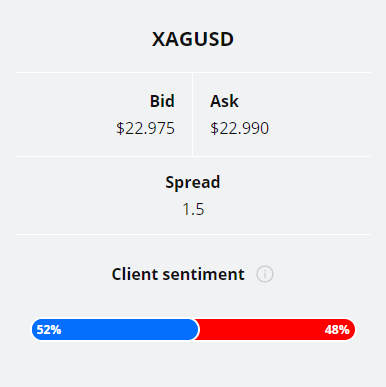
52% of clients trading XAGUSD are holding long positions, while 48% are holding short positions. Client sentiment data is being provided by TIO Markets Ltd.
Please note that retail client trading sentiment is often said to be a contrarian indicator. This is because trade data suggests that private (non-professional) traders, on average, trade against market price trends. You can follow the TIOmarkets client sentiment live on our Forex dashboard.
The next key risk events impacting this market
- USD - S&P/CS Composite-20 HPI y/y
- USD - CB Consumer Confidence
- USD - JOLTS Job Openings
- USD - ADP Non-Farm Employment Change
- USD - Employment Cost Index q/q
- USD - Chicago PMI
- USD - Federal Funds Rate
- USD - FOMC Statement
- USD - Unemployment Claims
- USD - ISM Manufacturing PMI
- USD - ISM Manufacturing Prices
- USD - Average Hourly Earnings m/m
- USD - Non-Farm Employment Change
- USD - Unemployment Rate
- USD - Revised UoM Consumer Sentiment
Potential Silver Market Moves
The 8h chart shows how the market has created a higher reactionary low at 22.70 in after it broke out of the bullish wedge. The width of the wedge provides us with a measured move target at 23.26. Alternatively, if the market breaks below 22.70, we could see a move down to 22.46.

How Would you Trade Silver Today?
I hope this silver technical analysis helps you to make better informed trading decisions. Check the latest market analysis for other instruments and subscribe to receive them in your inbox as soon as they are published
While research has been undertaken to compile the above content, it remains an informational and educational piece only. None of the content provided constitutes any form of investment advice.
TIO Markets UK Limited is a company registered in England and Wales under company number 06592025 and is authorised and regulated by the Financial Conduct Authority FRN: 488900
Risk warning: CFDs are complex instruments and come with a high risk of losing money rapidly due to leverage. 73% of retail investor accounts lose money when trading CFDs with this provider. You should consider whether you understand how CFDs work and whether you can afford to take the high risk of losing your money. Professional clients can lose more than they deposit. All trading involves risk.
DISCLAIMER: TIO Markets offers an exclusively execution-only service. The views expressed are for information purposes only. None of the content provided constitutes any form of investment advice. The comments are made available purely for educational and marketing purposes and do NOT constitute advice or investment recommendation (and should not be considered as such) and do not in any way constitute an invitation to acquire any financial instrument or product. TIOmarkets and its affiliates and consultants are not liable for any damages that may be caused by individual comments or statements by TIOmarkets analysis and assumes no liability with respect to the completeness and correctness of the content presented. The investor is solely responsible for the risk of his/her investment decisions. The analyses and comments presented do not include any consideration of your personal investment objectives, financial circumstances, or needs. The content has not been prepared in accordance with any legal requirements for financial analysis and must, therefore, be viewed by the reader as marketing information. TIOmarkets prohibits duplication or publication without explicit approval.

Janne Muta holds an M.Sc in finance and has over 20 years experience in analysing and trading the financial markets.
