Risk disclaimer: 76% of retail investor accounts lose money when trading CFDs and Spreadbets with this provider. You should consider whether you understand how CFDs and Spreadbets work and whether you can afford to take the high risk of losing your money.
Silver technical analysis | Dollar rally pushed XAGUSD lower
BY Janne Muta
|January 3, 2024Silver Technical Analysis – The 11% decline in silver prices since the December 4th peak can be attributed to the weakness in the gold market, which often correlates closely with silver. Gold's lack of strength during this period has indirectly influenced silver's market dynamics.
A significant catalyst for the recent downturn in silver prices was the rally of the US Dollar (USD) last week. The USD's strength is a crucial factor in the commodities market as it often trades inversely to precious metals like silver. When the dollar strengthens, it makes silver more expensive for investors using other currencies, leading to reduced demand and lower prices.
Additionally, major equity indices have shown signs of weakness lately, reflecting broader market sentiment becoming more cautious. This shift in market mood tends to favour more stable, yield-bearing assets. The surge in the USD Index underscores this trend, offering a higher-yield alternative to non-yielding assets like silver and gold.
This shift in investor preference has led to increased supply in the gold market, subsequently impacting silver prices due to their close association.
Furthermore, silver's role as an industrial metal makes it particularly sensitive to changes in market sentiment and economic cycles. Fluctuations in industrial demand and global economic conditions can have a pronounced effect on silver prices. Given its wide range of industrial applications, any downturn in global industrial activity can directly influence silver's demand and price.
Summary of This Silver Technical Analysis Report:
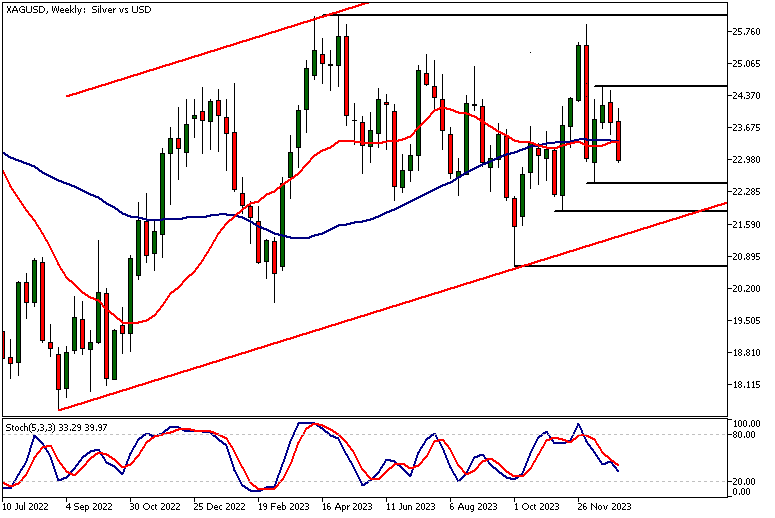
- Last week, silver created a lower swing high at 24.60 amid a strengthening USD. This trend suggests a potential decline to levels below the 22.50 support. Despite the long-term upward bias, the lower weekly swing high is a short-term bearish signal, possibly leading to a breach below 22.50.
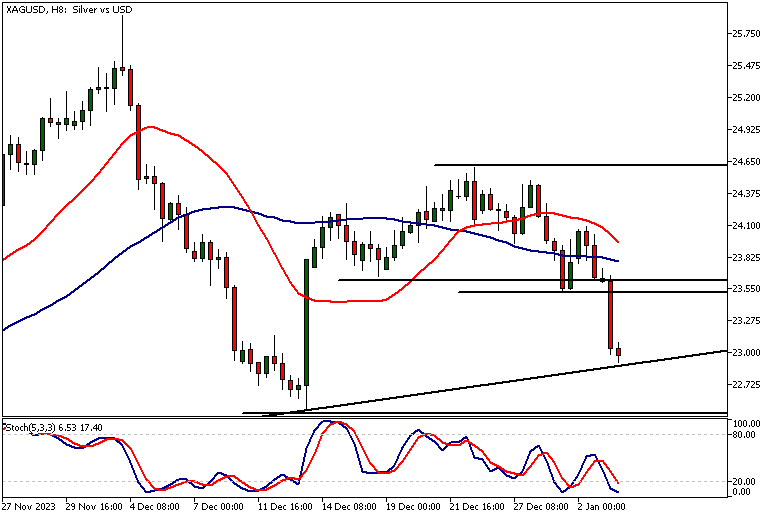
- On the daily chart, resistance is seen between 23.53 and 23.65, aligning with the SMA(50), indicating a key resistance zone. Currently, silver is at a rising trendline support. The analysis shows slight bullishness, but the recent USD strength and weekly chart trend warrant caution for silver bulls.
- In the last 30 minutes, silver reacted to the rising trend line support, hinting at a possible push higher. A return to the 23.53 - 23.65 resistance area is uncertain due to strong weekly and daily downtrends. The bearish indication from moving averages, with both pointing lower, reinforces the cautious outlook.
Read the full Silver technical analysis report below.
Silver Technical Analysis

Weekly Silver Technical Analysis
Silver created a lower swing high at 24.60 as the USD started to rally last week. This could lead to the silver market trading down to levels below the 22.50 support.
The market still has a long term upward bias but a lower weekly swing high typically is a short-term bearish indication that could lead to the market breaking below the nearest support level (22.50). How much below the level the market could move is impossible to estimate though. Traders should therefore monitor price action as it unfolds around the 22.50 level in the event of market trading down to the level.

Daily Silver Technical Analysis
The daily chart shows the nearest resistance area at 23.53 – 23.65. The area coincides with the SMA(50) suggesting it could be an important resistance area should the market rally back to it either today or tomorrow. The market is currently trading at a rising trendline support.
Moving averages based silver technical analysis indicates slight bullishness but the lower swing high in the weekly chart (together with the recent USD strength) suggests silver bulls should perhaps be cautious.

Intraday Silver Technical Analysis
Silver has reacted to the proximity of the rising trend line support over the last 30 minutes. Whether this turns into a trading opportunity for the bulls is still too early to say.
We might see a return move to the nearest resistance area at 23.53 – 23.65, but with the strong downside momentum in the weekly and daily charts the likelihood of such a move could be smaller than during a strong uptrend. Moving averages-based Silver technical analysis suggests the market is bearish with both moving averages pointing lower. Even though the fast SMA(20) is above the slow SMA(50) with both moving averages pointing lower the indication is bearish.
The next key risk events impacting this market
- FOMC Meeting Minutes
- ADP Non-Farm Employment Change
- Unemployment Claims
- Average Hourly Earnings m/m
- Non-Farm Employment Change
- ISM Services PMI
- FOMC Member Barkin Speaks
Potential Silver Market Moves
In a bullish scenario, silver could rally back to the resistance area at 23.53 – 23.65, especially if the trendline support holds. Conversely, the bearish scenario involves silver breaking below the 22.50 support level, influenced by the lower weekly swing high and USD strength. The extent of the potential decline below 22.50 is uncertain, necessitating close monitoring of price action around this level.

How would you trade the Silver today?
I hope this silver technical analysis helps you to make better informed trading decisions. Check the latest market analysis for other instruments and subscribe to receive them in your inbox as soon as they are published
While research has been undertaken to compile the above content, it remains an informational and educational piece only. None of the content provided constitutes any form of investment advice.
TIO Markets UK Limited is a company registered in England and Wales under company number 06592025 and is authorised and regulated by the Financial Conduct Authority FRN: 488900
Risk warning: CFDs are complex instruments and come with a high risk of losing money rapidly due to leverage. 73% of retail investor accounts lose money when trading CFDs with this provider. You should consider whether you understand how CFDs work and whether you can afford to take the high risk of losing your money. Professional clients can lose more than they deposit. All trading involves risk.
DISCLAIMER: TIO Markets offers an exclusively execution-only service. The views expressed are for information purposes only. None of the content provided constitutes any form of investment advice. The comments are made available purely for educational and marketing purposes and do NOT constitute advice or investment recommendation (and should not be considered as such) and do not in any way constitute an invitation to acquire any financial instrument or product. TIOmarkets and its affiliates and consultants are not liable for any damages that may be caused by individual comments or statements by TIOmarkets analysis and assumes no liability with respect to the completeness and correctness of the content presented. The investor is solely responsible for the risk of his/her investment decisions. The analyses and comments presented do not include any consideration of your personal investment objectives, financial circumstances, or needs. The content has not been prepared in accordance with any legal requirements for financial analysis and must, therefore, be viewed by the reader as marketing information. TIOmarkets prohibits duplication or publication without explicit approval.

Janne Muta holds an M.Sc in finance and has over 20 years experience in analysing and trading the financial markets.
