Risk disclaimer: 76% of retail investor accounts lose money when trading CFDs and Spreadbets with this provider. You should consider whether you understand how CFDs and Spreadbets work and whether you can afford to take the high risk of losing your money.
S P 500 technical analysis | Tech Stocks Weigh on the SP 500 Index
BY Janne Muta
|October 27, 2023S P 500 technical analysis - Big technology stocks selling off have dragged down not only the technology index Nasdaq but also the S&P 500. Technology stocks with their 28.2% weighting are the largest sector in the index their movements are reflected in the S&P 500 accordingly.
Concerns on Economic Data
Yesterday's down move came after the latest data shows Americans are saving less and their incomes are falling when adjusted for inflation. This could mean the future growth prospects are more limited. Today's PCE data release and the following price action will tell us more about the the collective opinion of the market operators.
Middle East Tensions
Additionally, the potential of the war between Israel and Hamas expanding further in the Middle East worries investors.
Summary of this S P 500 technical analysis report
- Recent data reveals Americans are saving less, and their incomes are decreasing when adjusted for inflation.
- The potential escalation of conflict between Israel and Hamas is also concerning investors.
- The S&P 500 has broken below its bullish channel. Despite some positive indications, the bearish breakout suggests further downward pressure.
- The market is showing signs of bearishness, with lower lows and lower highs on the weekly timeframe. Both daily and weekly analyses suggest caution, with the probability of support levels breaking being higher.
Read our full S P 500 technical analysis report below.
SP 500 Technical Analysis
S P 500 Technical Analysis, Weekly
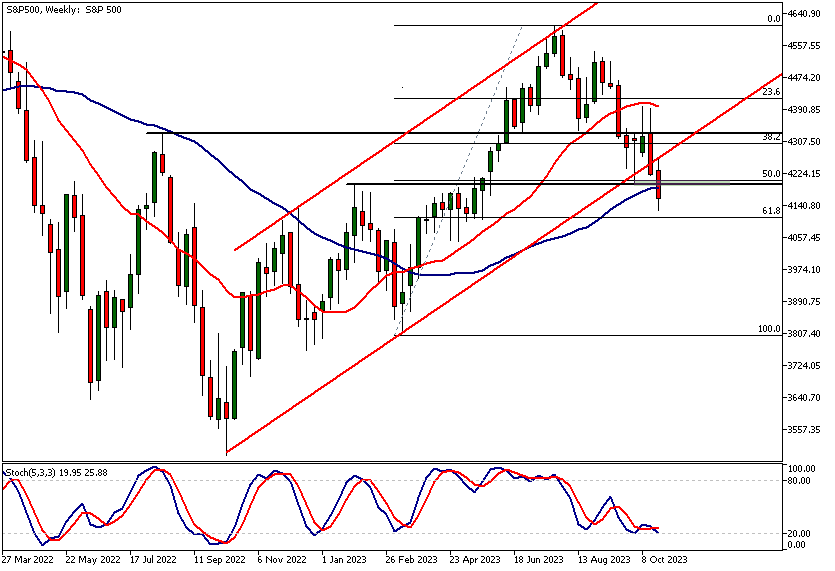
The S&P 500 Index has broken below the bull channel low. The market has declined 485 index points or 10 points 5% since the July high. While the moving averages are still pointing higher and the 20 period SMA is above the 50 period, the bearish channel breakout suggests further downside pressure in the market.
Stochastic Oscillator Overview
The stochastic oscillator is in the oversold condition with a current value of 18.27. Note however that during down-trending markets, the stochastic oscillator can remain at or near oversold levels without a rally in the market.
Key Support at 4108
The next technical conference level can be found at 4108 where the 61.8% Fibonacci retracement level and a market structure level created in May this year coincide. If this level fails to support the market, traders might be targeting the 4044 support level.
Potential Rally Scenario
Alternatively, should the market attract buying at the 61.8% Fibonacci retracement level, look for a move to the 50% retracement level that coincides with a market structure level at 4204. Keep in mind though, that with the market creating lower lows and lower highs in the weekly time frame chart, the probability of support levels breaking and rallies failing at resistance levels is greater than during uptrends.
S P 500 Technical Analysis, Daily
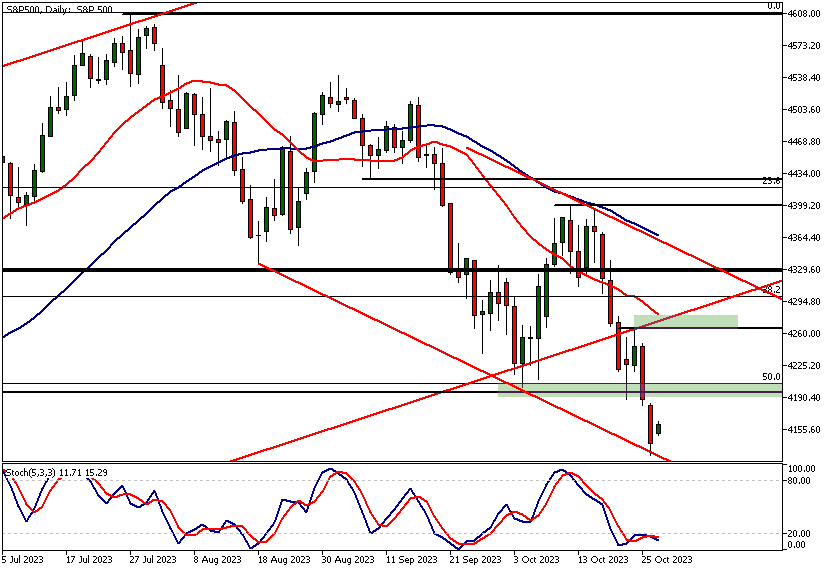
The daily chart reveals the market trading close to the lower end of the bearish trend channel. The stochastic oscillator is currently at 15.27 indicating together with the current market positioning that yesterday's downside move could be overextended.
Potential Rebound
Therefore a rebound from the channel low could be in the cards. If the market rallies from here pay attention to the price action near the 50% Fibonacci retracement level at 4209. If the bulls are capable of pushing the market above this level our S&P 500 analysis suggests the market could move to the confluence area at the 4266 - 4280 range.
S P 500 Technical Analysis, 4h
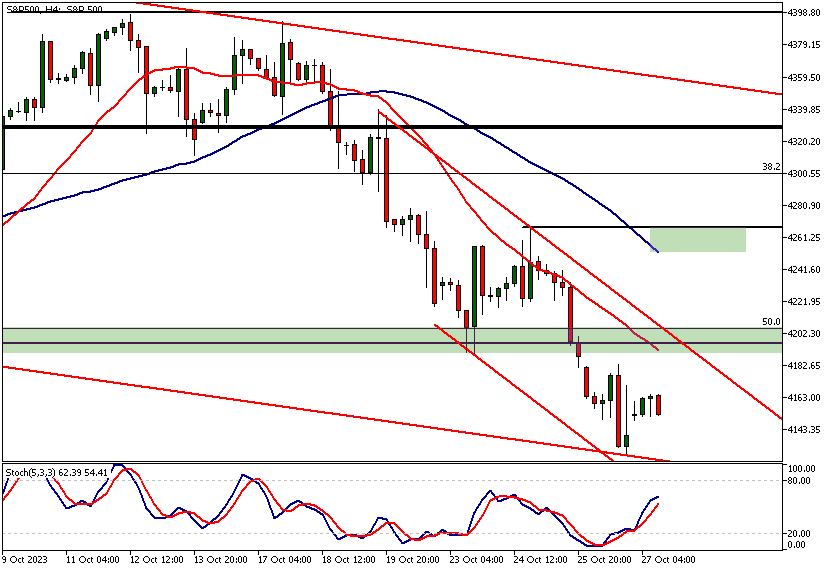
In the 4-hour time frame S&P 500 is trading lower inside a bearish trend Channel with the moving averages pointing lower. the 20-period SMA is below the 50-period signaling bearishness in the market.
Confluence Area
The bear channel high and the 20-period SMA are closely aligned with the 50% Fibonacci retracement level we identified in the daily and weekly S&P 500 technical analysis sections above. the stochastic oscillator is pointing higher and if the contra trend move continues it might well be soon in the overbought area.
Client sentiment analysis
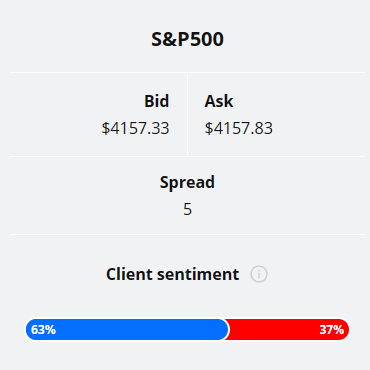
TIOmarkets clients are mildly bullish on S P 500 with 63% of clients holding long positions and 37% holding short positions in the market.
Please remember that the retail trader client sentiment is a contrarian indicator as most of the retail traders are on average betting against the market trends. This is why, experienced traders tend to trade against the retail client sentiment. You can follow the TIOmarkets client sentiment live on our Forex dashboard.
The Next Key Risk Events
- Core PCE Price Index
- Revised UoM Consumer Sentiment
- Employment Cost Index
- Chicago PMI
- CB Consumer Confidence
Potential S P 500 market moves
The S&P 500 breaking below its bullish channel low coupled with declining tech stocks indicates further downside in the market. The market's decline of 10.5% since July and overarching macroeconomic factors could lead to a further downward trajectory, possibly testing the 4044 support level.
With the stochastic oscillator indicating an oversold condition in the daily chart, and the market trading near the lower end of its bearish channel, a rally towards the 4266-4280 range could take place if the 50% retracement level is exceeded decisively.
How would you trade S P 500 today?
I hope this fundamental and technical analysis of S P 500 helps you make better informed trading decisions. Check the latest market analysis for other instruments and subscribe to receive them in your inbox as soon as they are published
While research has been undertaken to compile the above content, it remains an informational and educational piece only. None of the content provided constitutes any form of investment advice.
Tio Markets UK Limited is a company registered in England and Wales under company number 06592025 and is authorised and regulated by the Financial Conduct Authority FRN: 488900
Risk warning: CFDs are complex instruments and come with a high risk of losing money rapidly due to leverage. 82% of retail investor accounts lose money when trading CFDs with this provider. You should consider whether you understand how CFDs work and whether you can afford to take the high risk of losing your money. Professional clients can lose more than they deposit. All trading involves risk.
DISCLAIMER: Tio Markets offers an exclusively execution-only service. The views expressed are for information purposes only. None of the content provided constitutes any form of investment advice. The comments are made available purely for educational and marketing purposes and do NOT constitute advice or investment recommendation (and should not be considered as such) and do not in any way constitute an invitation to acquire any financial instrument or product. TIOmarkets and its affiliates and consultants are not liable for any damages that may be caused by individual comments or statements by TIOmarkets analysis and assumes no liability with respect to the completeness and correctness of the content presented. The investor is solely responsible for the risk of his/her investment decisions. The analyses and comments presented do not include any consideration of your personal investment objectives, financial circumstances, or needs. The content has not been prepared in accordance with any legal requirements for financial analysis and must, therefore, be viewed by the reader as marketing information. TIOmarkets prohibits duplication or publication without explicit approval.

Janne Muta holds an M.Sc in finance and has over 20 years experience in analysing and trading the financial markets.
