Risk disclaimer: 76% of retail investor accounts lose money when trading CFDs and Spreadbets with this provider. You should consider whether you understand how CFDs and Spreadbets work and whether you can afford to take the high risk of losing your money.
Oil Technical Analysis | US shale efficiency drives prices lower
BY Janne Muta
|December 6, 2023Oil technical analysis - This week, oil prices experienced a 4.6% decline, underscoring the challenges faced by OPEC in stabilizing the market through production cuts. Reuters reports that advancements in efficiency within the US shale sector have enabled consistent production growth, despite lower oil prices and fewer drilling rigs. This efficiency has driven US oil production to unprecedented levels, exerting additional downward pressure on oil prices.
A key reason for the oil price decline is the significant increase in US crude oil production, which reached a record high of 13.24 million barrels per day in September 2023. This surge, resulting from efficiency improvements in the shale industry, has diminished OPEC’s and Saudi Arabia's market control. Oil price weakness has prompted Russian president to fly over to UAE to discuss the oil market.
Looking ahead, the global oil landscape is poised for considerable shifts, largely influenced by the increasing focus on electrification and anticipated reductions in oil consumption within the transportation sector.
This sector, which accounts for about 60% of worldwide oil demand, is likely to see a decline as the adoption of electric vehicles (EVs) accelerates. Projections suggest a potential decrease in oil demand by up to 5 million barrels per day by 2030.
In response, major oil corporations and governments in the top oil-consuming nations, including the United States and China, are revising their oil demand forecasts to reflect these evolving trends and the expected long-term impact on the oil market.
Summary of This Oil Technical Analysis Report:
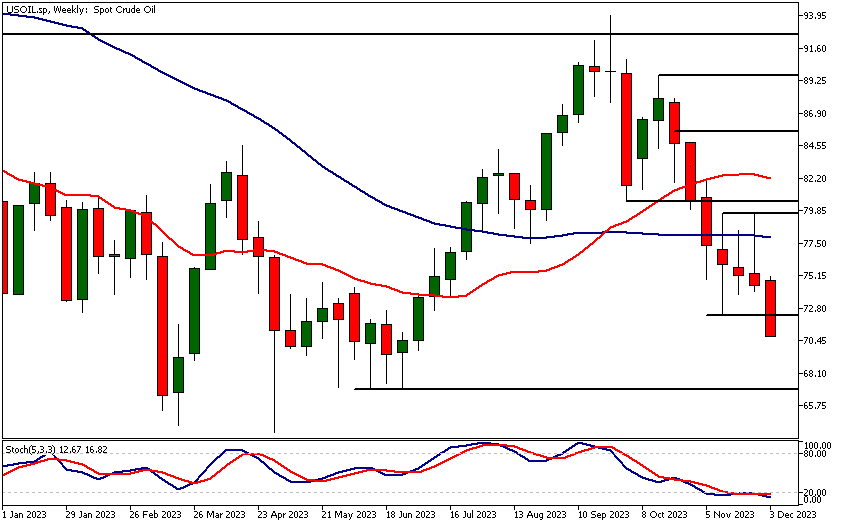
- The price of oil has dropped by over 11% since the market failed to rally above the 79.63 resistance level. Last week, the market formed a bearish rejection candle, signalling further downward pressure on the price of oil. The market continues to exhibit bearish tendencies on the weekly chart and could potentially decline to 69.75, and even further to 67.40 on an extended move.
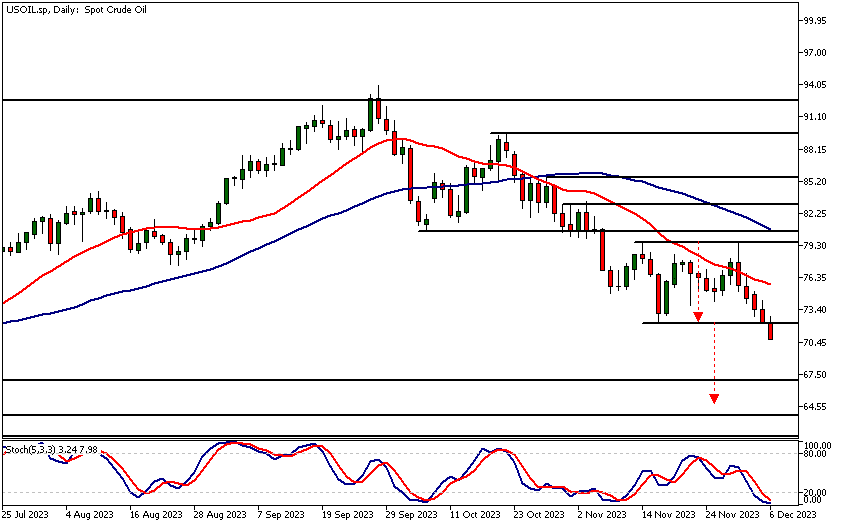
- The daily chart shows that oil has broken below a price range it traded within for approximately three weeks. The measured move target based on this range points to 64.90. It's worth noting, though, that there is a key market structure level at 67.12 which could attract short covering and even speculative buying.
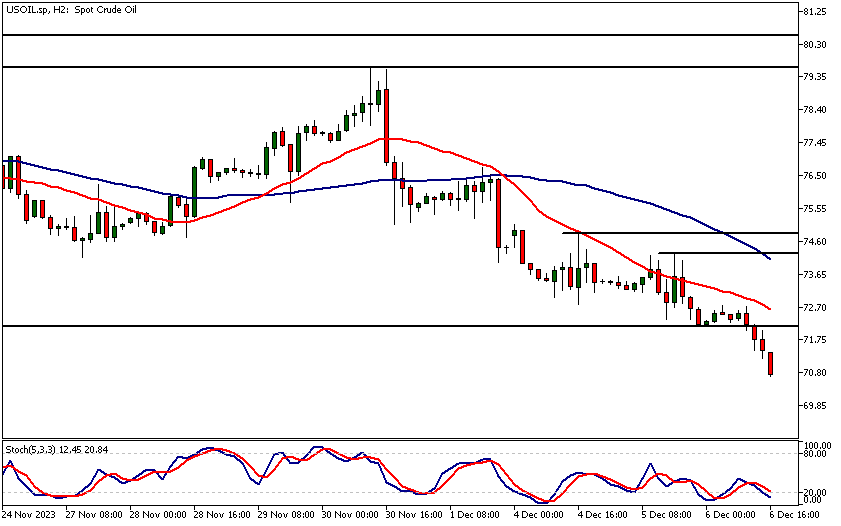
- In the two-hour chart, the closest key resistance level is at 72.15, with subsequent resistance levels located at 74.26 and 74.81.
Read the full Oil Technical Analysis report below.
Oil Technical Analysis

Weekly Oil Technical Analysis
The price of oil has dropped by over 11% since the market failed to rally above the 79.63 resistance level. Last week, the market formed a bearish rejection candle, signalling further downward pressure on the price of oil. The market continues to exhibit bearish tendencies on the weekly chart and could potentially decline to 69.75, and even further to 67.40 on an extended move.
Alternatively, our oil technical analysis suggests that if there were a counter-trend rally, we might observe oil trading up to approximately 73.80. The market is currently in an oversold condition according to the stochastic oscillator but such indicators tend to lose their validity when a market is in a persistent downtrend.

Daily Oil Technical Analysis
The daily chart shows that oil has broken below a price range it traded within for approximately three weeks. The measured move target based on this range points to 64.90.
A key market structure level
It's worth noting, though, that there is a key market structure level at 67.12 which could attract short covering and even speculative buying. Therefore, there's no guarantee that the market will reach the measured move target. Alternatively, if the market rallies back within the price range, it might move up to around 73.80.
As per indicator-based oil technical analysis, the market remains bearish in this time frame, with the moving averages pointing lower and the fast-moving average positioned below the slow-moving average.

Oil Technical Analysis, 2h
In the two-hour chart, the closest key resistance level is at 72.15, with subsequent resistance levels located at 74.26 and 74.81. It's worth noting that the 74.26 level closely aligns with the 50-period moving average.
Consequently, the range between 74.26 and 74.81 could represent a significant resistance area. Indicator-based oil technical analysis supports the price action-based analysis, confirming that the oil market remains in a bearish state.

Client sentiment analysis
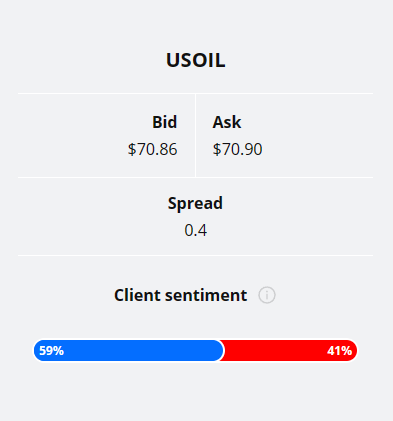
TIOmarkets' clientele are mildly bullish on USOIL, with 59% of clients holding long positions and 41% shorting the market.
Please remember that the retail trader client sentiment is a contrarian indicator as most of the retail traders are on average betting against the market trends. This is why, experienced traders tend to trade against the retail client sentiment. You can follow the TIOmarkets client sentiment live on our Forex dashboard.
The next key risk events impacting this market
- USD - Crude Oil Inventories
- USD - Average Hourly Earnings
- USD - Non-Farm Employment Change
- USD - Unemployment Rate
- USD - Prelim UoM Consumer Sentiment
- USD - Prelim UoM Inflation Expectations
Potential Oil Market Moves
The market continues to exhibit bearish tendencies on the weekly chart and could potentially decline to 69.75, and even further to 67.40 on an extended move.
Alternatively, our oil technical analysis suggests that if there were a counter-trend rally, we might observe oil trading up to approximately 73.80.

How would you trade the Oil today?
I hope this Oil technical analysis helps you to make better informed trading decisions. Check the latest market analysis for other instruments and subscribe to receive them in your inbox as soon as they are published
While research has been undertaken to compile the above content, it remains an informational and educational piece only. None of the content provided constitutes any form of investment advice.
TIO Markets UK Limited is a company registered in England and Wales under company number 06592025 and is authorised and regulated by the Financial Conduct Authority FRN: 488900
Risk warning: CFDs are complex instruments and come with a high risk of losing money rapidly due to leverage. 73% of retail investor accounts lose money when trading CFDs with this provider. You should consider whether you understand how CFDs work and whether you can afford to take the high risk of losing your money. Professional clients can lose more than they deposit. All trading involves risk.
DISCLAIMER: TIO Markets offers an exclusively execution-only service. The views expressed are for information purposes only. None of the content provided constitutes any form of investment advice. The comments are made available purely for educational and marketing purposes and do NOT constitute advice or investment recommendation (and should not be considered as such) and do not in any way constitute an invitation to acquire any financial instrument or product. TIOmarkets and its affiliates and consultants are not liable for any damages that may be caused by individual comments or statements by TIOmarkets analysis and assumes no liability with respect to the completeness and correctness of the content presented. The investor is solely responsible for the risk of his/her investment decisions. The analyses and comments presented do not include any consideration of your personal investment objectives, financial circumstances, or needs. The content has not been prepared in accordance with any legal requirements for financial analysis and must, therefore, be viewed by the reader as marketing information. TIOmarkets prohibits duplication or publication without explicit approval.

Janne Muta holds an M.Sc in finance and has over 20 years experience in analysing and trading the financial markets.
