Risk disclaimer: 76% of retail investor accounts lose money when trading CFDs and Spreadbets with this provider. You should consider whether you understand how CFDs and Spreadbets work and whether you can afford to take the high risk of losing your money.
Oil Technical Analysis | The market creates another higher swing low
BY Janne Muta
|January 10, 2024Oil Technical Analysis - The price of USOIL rose by 1.8% yesterday. According to Reuters, a substantial drop in US crude inventories has supported the price, alongside concerns over supply disruptions such as a Libyan outage and ongoing regional tensions. Yemen's Houthi militia carried out new attacks on shipping in the Red Sea, increasing fears that oil tanker flows could be affected.
Yesterday, the US Energy Information Administration (EIA) stated its anticipation of a lower growth rate of 1.4 million barrels per day (bpd) in global liquid fuels consumption in 2024, compared to the 1.9 million bpd growth in 2023. This is attributed to a weaker Chinese economy. The EIA is set to release its data later today.
As USOIL is traded in dollars, its performance is to a certain extent influenced by the dollar movements which in turn is highly dependent on the Fed policy. Investors are therefore waiting for the US CPI release to gain a clearer view of inflation trends and the likely Fed timetable of Fed rate cuts.
Lately, the dollar has been edging higher as the bond market has adjusted to expectations that the Fed isn't likely to cut rates as aggressively as markets earlier expected. Lower bond prices lead to higher yields, which in turn support the dollar.
In November 2023, core US consumer price inflation remained stable at 4%, marking a two-year low, albeit with a slight increase from October. The annual inflation rate dipped to 3.1%, a five-month low, driven by falling energy costs. However, shelter costs pushed up consumer prices slightly, and analysts predict a modest rise in headline inflation to 3.2%.
Summary of This Oil Technical Analysis Report:
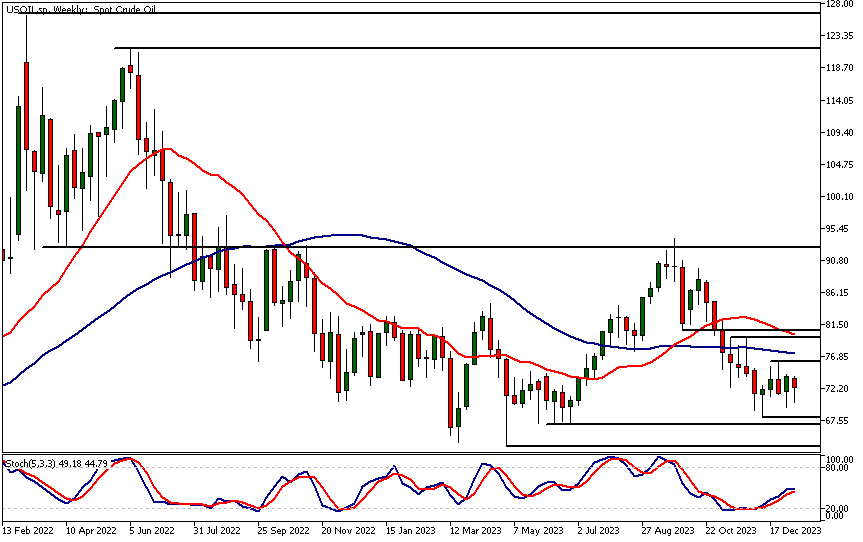
- Oil is consolidating around 67.94, indicating a possible bottoming process and potential trend reversal. A break above 76.18 could lead to a rise towards the 20-period moving average at 80, while failure may drop it to around 64.50.
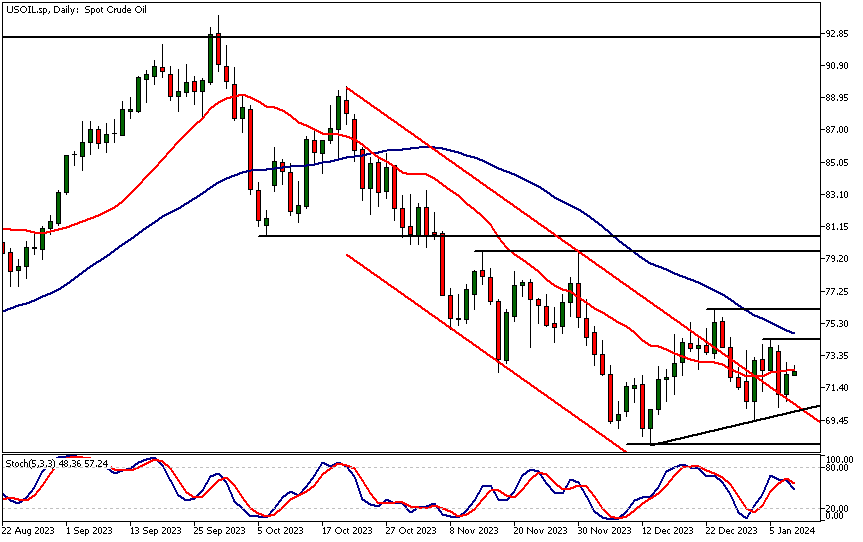
- Oil shows higher lows on the daily chart, with the 20-period moving average nearing the 50-period average. Resistance levels at 74.25 and 76.18 are key. A break above these could indicate a trend reversal, while failure might result in continued consolidation or a decline towards 67.94 or 64.50.
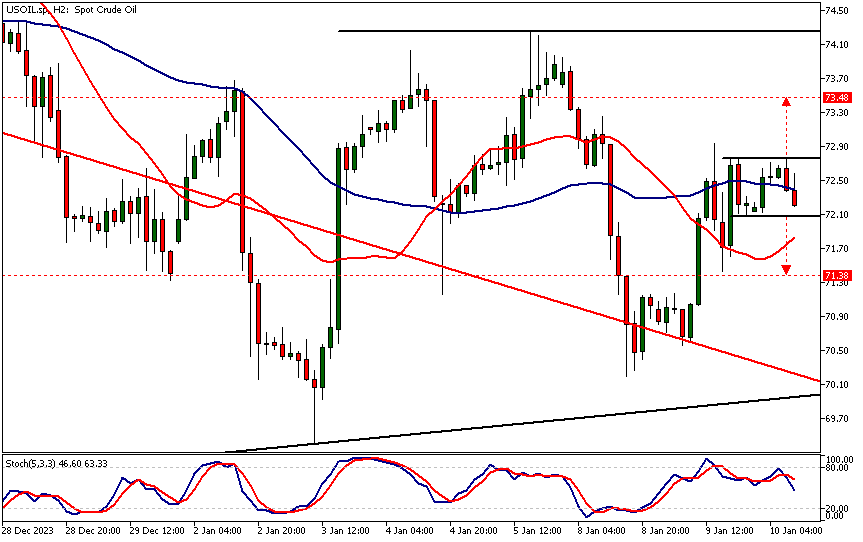
- Currently, oil trades between 72.09 and 72.76. A breakout from this range suggests targets at 73.48 and 71.38. However, with moving averages converging and moving sideways, the market lacks a clear direction, implying potential for further movement as trends develop.
Read the full oil technical analysis report below.
Oil Technical Analysis
Daily Oil Technical Analysis
Oil has created two higher reactionary lows on the daily chart. Simultaneously, the 20-period moving average has begun to edge closer to the 50-period moving average. This contraction in moving averages is a response to the market attracting buyers and creating higher swing lows. The nearest potential supply levels are the resistance levels at 74.25 and 76.18.
Although the market is showing signs of a potential trend reversal, the real test for the bulls is still ahead: Traders need to push the market above these levels and then attract additional buying above them. Should they fail to do so, there are only two options: either the oil market will continue consolidating or it will start to trade lower. In the latter case, we could see the market trading down to 67.94 and possibly to 64.50 as an extension.
Intraday Oil Technical Analysis
At the time of writing this report, oil is trading in a narrow range between 72.09 and 72.76. As is often the case, a breakout from this range will provide us with measured move targets on both the upside and the downside.
The upside and downside targets are 73.48 and 71.38, respectively. It is important to note that in technical analysis, measured move targets are often considered near-term targets. Therefore, generally, the markets are likely to move further as trends develop.
At the same time, moving averages-based oil technical analysis does not provide a clear directional indication at present, as the moving averages are moving sideways and converging.
Client sentiment analysis
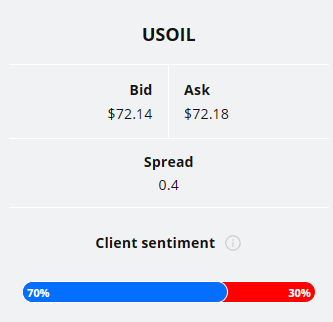
70% of clients trading USOIL are holding long positions, while 30% are holding short positions. Client sentiment data is being provided by TIO Markets Ltd.
It’s good to remember that retail client trading sentiment is a contrarian indicator as most retail traders are on average trading against market price trends. This is why experienced traders tend to trade against the retail client sentiment. You can follow the TIOmarkets client sentiment live on our Forex dashboard.
The next key risk events impacting this market
- Crude Oil Inventories
- USD - 10-y Bond Auction
- USD - Core CPI m/m
- USD - CPI m/m
- USD - CPI y/y
- USD - Unemployment Claims
- USD - 30-y Bond Auction
- USD - Core PPI m/m
- USD - PPI m/m
Potential Oil Market Moves
If oil breaks above the key resistance levels, especially 76.18, it could signal a trend reversal, potentially leading to a rise towards the 20-period moving average at 80. Alternatively, a failure to break these resistance levels might lead to a continuation of the current consolidation phase or a decline towards 67.94, and possibly extending to 64.50.

How Would You Trade Oil Today?
I hope this Oil technical analysis helps you to make better informed trading decisions. Check the latest market analysis for other instruments and subscribe to receive them in your inbox as soon as they are published
While research has been undertaken to compile the above content, it remains an informational and educational piece only. None of the content provided constitutes any form of investment advice.
TIO Markets UK Limited is a company registered in England and Wales under company number 06592025 and is authorised and regulated by the Financial Conduct Authority FRN: 488900
Risk warning: CFDs are complex instruments and come with a high risk of losing money rapidly due to leverage. 73% of retail investor accounts lose money when trading CFDs with this provider. You should consider whether you understand how CFDs work and whether you can afford to take the high risk of losing your money. Professional clients can lose more than they deposit. All trading involves risk.
DISCLAIMER: TIO Markets offers an exclusively execution-only service. The views expressed are for information purposes only. None of the content provided constitutes any form of investment advice. The comments are made available purely for educational and marketing purposes and do NOT constitute advice or investment recommendation (and should not be considered as such) and do not in any way constitute an invitation to acquire any financial instrument or product. TIOmarkets and its affiliates and consultants are not liable for any damages that may be caused by individual comments or statements by TIOmarkets analysis and assumes no liability with respect to the completeness and correctness of the content presented. The investor is solely responsible for the risk of his/her investment decisions. The analyses and comments presented do not include any consideration of your personal investment objectives, financial circumstances, or needs. The content has not been prepared in accordance with any legal requirements for financial analysis and must, therefore, be viewed by the reader as marketing information. TIOmarkets prohibits duplication or publication without explicit approval.

Janne Muta holds an M.Sc in finance and has over 20 years experience in analysing and trading the financial markets.
