Risk disclaimer: 76% of retail investor accounts lose money when trading CFDs and Spreadbets with this provider. You should consider whether you understand how CFDs and Spreadbets work and whether you can afford to take the high risk of losing your money.
Oil Technical Analysis | Oil remains in downtrend
BY Janne Muta
|November 13, 2023Oil technical analysis - The recent decline in oil prices stems from multiple factors. The fact that Russian oil exports have remained robust alongside with increased production from other countries, has led to a surplus in supply which obviously pressures the oil price. OPEC+ has attempted to stabilize prices through production cuts, but these were offset by increased output from the U.S.
Economic factors, such as a potentially weakening economy globally, higher interest rates, and a stronger dollar have further dampened oil demand. Furthermore, WSJ writes, market dynamics like "buying exhaustion" where businesses anticipated a tight market and purchased oil ahead of time. and increased speculative trading contributed to the downward pressure on oil prices.
Summary of This Oil Technical Analysis Report:
- The weekly chart shows that US oil has traded down to a major market structure level at 74.67 and has bounced higher. This suggests that the downside in the oil market in the weekly timeframe could be getting limited.
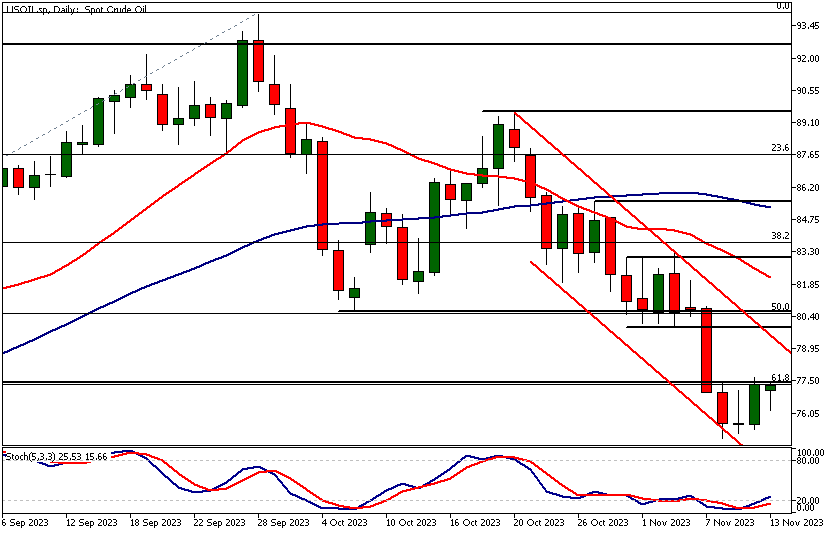
- Oil is trending down on the daily chart, currently trading at a resistance level of 77.55, which aligns with the 61.8% Fibonacci retracement level. A decisive rally above this level could lead to the market reaching approximately 80.09. Conversely, if the 77.55 level is not permanently breached, a decline to 74.92 and possibly to 73.90 could follow.
Read the full Oil Technical Analysis report below.
Oil Technical Analysis

Weekly Oil Technical Analysis
The weekly chart shows that US oil has traded down to a major market structure level at 74.67 and has bounced higher. Oil technical analysis therefore suggests that the downside in the oil market in the weekly timeframe could be getting limited.
The 74.67 price level is the top of a base formation that the market created in April and May this year. Therefore, the major players in the oil market could be relatively soon seeing value in the oil market. The decline from the September high to last week's low was, after all, approximately 20%.
Key price levels
However, with significant market structure levels fairly close by at 77.51 and 80.62, it could mean that the market is more likely to consolidate for a while before it can start moving higher. This oil technical analysis assumes that there are no major market moving news on oil that would change the technical picture.
Therefore, we could see another leg to the downside in US oil before the market is ready to reverse the recent downward move.

Daily Oil Technical Analysis
Oil is trending down on the daily chart, currently trading at a resistance level of 77.55, which aligns with the 61.8% Fibonacci retracement level. A decisive rally above this level could lead to the market reaching approximately 80.09.
Conversely, if the 77.55 level is not permanently breached, a decline to 74.92 and possibly to 73.90 could follow.
Technical indications
For those focused on indicators in oil technical analysis, it's noted that the fast-moving average (20-periods) is still below the slow-moving average (50-periods). The stochastic oscillator is rising from an oversold condition, but it's typical for oscillators to stay near oversold levels in downtrending markets.

Oil Technical Analysis, 4h
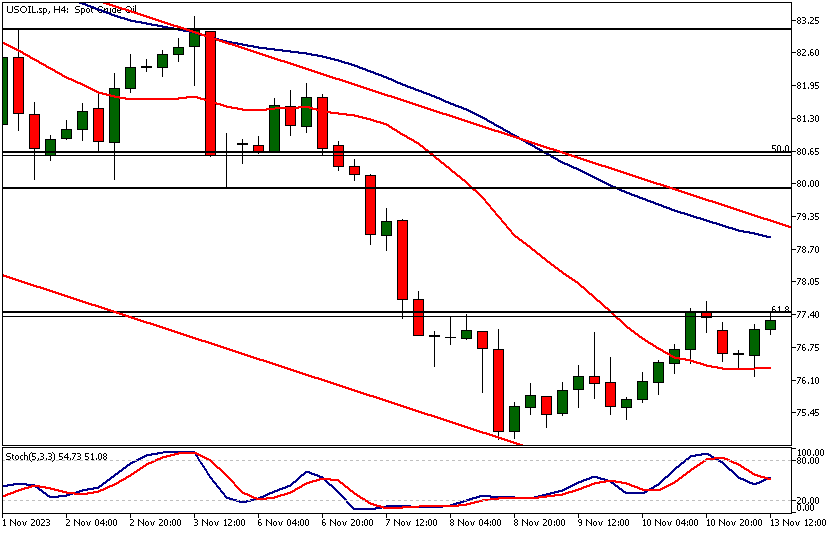
The 4-hour chart indicates that the oil market is trading below the 77.55 resistance level. There was buying interest at 76.17 today, but for a further rally, bulls need to push the market above 77.67 and establish higher lows to indicate new capital inflow.
The bear channel high and the 50-period Simple Moving Average (SMA), currently at 78.93, are nearby, suggesting some traders might take profits if the market rallies to this SMA. Oil technical analysis suggests that if a lower swing high is formed below 77.67, the market could decline to 74.92.

Client sentiment analysis
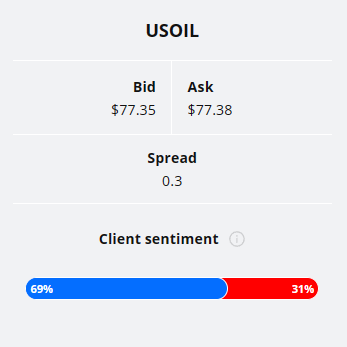
TIOmarkets' clientele are bullish on USOIL, with 69% of clients holding long positions and only 31% shorting the market.
Please remember that the retail trader client sentiment is a contrarian indicator as most of the retail traders are on average betting against the market trends. This is why, experienced traders tend to trade against the retail client sentiment. You can follow the TIOmarkets client sentiment live on our Forex dashboard.
The next key risk events impacting this market:
- USD-CPI
- USD-Core PPI
- USD-Retail Sales
- USD-Empire State Manufacturing Index
- USD-PPI
- Crude Oil Inventories

Potential Oil Market Moves
Oil is trending down on the daily chart, currently trading at a resistance level of 77.55, which aligns with the 61.8% Fibonacci retracement level. A decisive rally above this level could lead to the market reaching approximately 80.09.
Conversely, if the 77.55 level is not permanently breached, a decline to 74.92 and possibly to 73.90 could follow.
How would you trade the Oil today?
I hope this fundamental and technical Oil analysis helps you to make better informed trading decisions. Check the latest market analysis for other instruments and subscribe to receive them in your inbox as soon as they are published
While research has been undertaken to compile the above content, it remains an informational and educational piece only. None of the content provided constitutes any form of investment advice.
TIO Markets UK Limited is a company registered in England and Wales under company number 06592025 and is authorised and regulated by the Financial Conduct Authority FRN: 488900
Risk warning: CFDs are complex instruments and come with a high risk of losing money rapidly due to leverage. 82% of retail investor accounts lose money when trading CFDs with this provider. You should consider whether you understand how CFDs work and whether you can afford to take the high risk of losing your money. Professional clients can lose more than they deposit. All trading involves risk.
DISCLAIMER: TIO Markets offers an exclusively execution-only service. The views expressed are for information purposes only. None of the content provided constitutes any form of investment advice. The comments are made available purely for educational and marketing purposes and do NOT constitute advice or investment recommendation (and should not be considered as such) and do not in any way constitute an invitation to acquire any financial instrument or product. TIOmarkets and its affiliates and consultants are not liable for any damages that may be caused by individual comments or statements by TIOmarkets analysis and assumes no liability with respect to the completeness and correctness of the content presented. The investor is solely responsible for the risk of his/her investment decisions. The analyses and comments presented do not include any consideration of your personal investment objectives, financial circumstances, or needs. The content has not been prepared in accordance with any legal requirements for financial analysis and must, therefore, be viewed by the reader as marketing information. TIOmarkets prohibits duplication or publication without explicit approval.

Janne Muta holds an M.Sc in finance and has over 20 years experience in analysing and trading the financial markets.
