Risk disclaimer: 76% of retail investor accounts lose money when trading CFDs and Spreadbets with this provider. You should consider whether you understand how CFDs and Spreadbets work and whether you can afford to take the high risk of losing your money.
Oil Technical Analysis | Market reacts to OPEC+ output cut talks
BY Janne Muta
|November 29, 2023Oil technical analysis - A weaker dollar and anticipation of the upcoming OPEC+ meeting could agree on production cuts has lifted the price of oil yesterday and today. According to Reuters, the meeting was initially postponed due to disagreements over output quotas for African producers, but these issues have been largely resolved.
The focus includes the United Arab Emirates' permitted output increase in 2024, as per OPEC+'s last agreement in June. Negotiations have been described as tough, with countries holding firm on their positions.
Saudi Arabia, Russia, and other members have pledged total oil output cuts of about 5 million barrels per day (bpd), roughly 5% of global demand, starting from late 2022. This includes Saudi Arabia's voluntary cut of 1 million bpd and Russia's export cut of 300,000 bpd, both set to expire at year's end.
Analysts interviewed by Wall Street Journal, however, point out that given the existing aggressive cuts, there's uncertainty about the extent to which OPEC+ can further reduce output to significantly impact the market.
Summary of This Oil Technical Analysis Report:
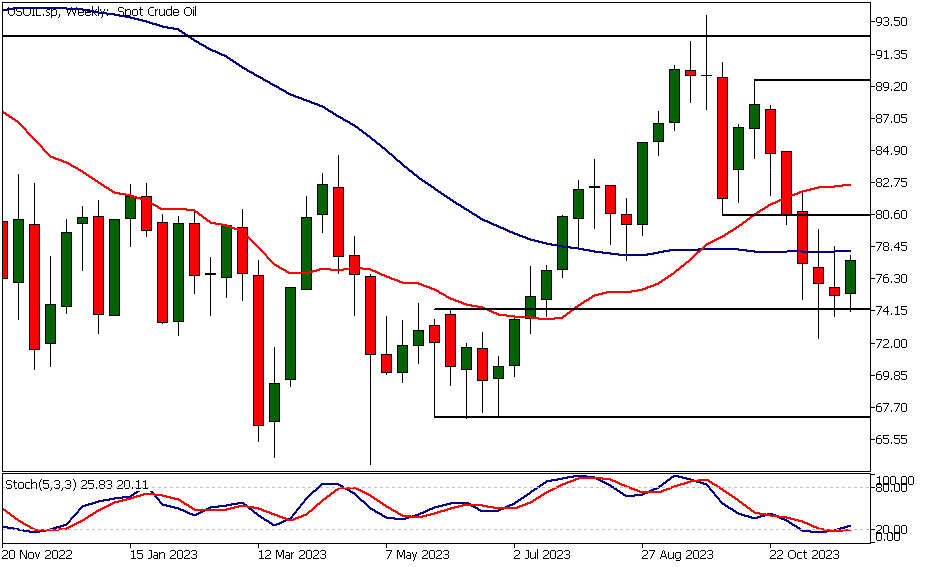
- After trading lower, the oil market has steadied above a bottoming formation created in the spring. If the market closes today above $75.72, this week will mark the first up week in five weeks. It also appears likely that this week's lowest low will be higher than the previous week's, indicating signs of market stabilization.
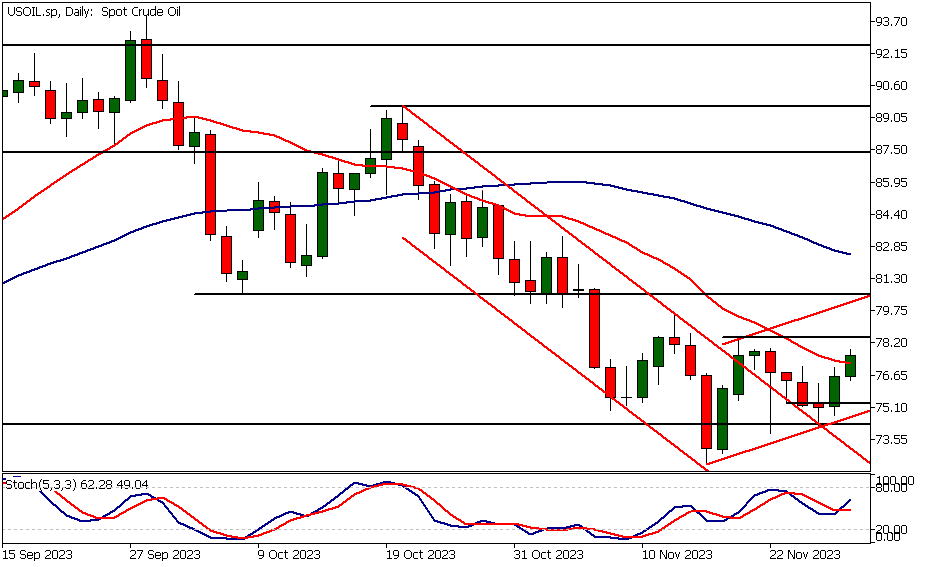
- The daily chart shows US oil moving above the top of the bear channel. The bullish breakout has been moderate but the market is no longer confined within the channel. Two days ago, the market formed a bullish rejection candle, suggesting it might be ready to move higher.
- Moving average-based oil technical analysis still shows the market in a downtrend, but with the 20-period moving average converging with the 50-period SMA. The stochastic oscillator has also formed a higher reactionary low, indicating that the downside momentum is waning and the market is attempting to reverse the recent downtrend. However, for this reversal to become a reality, the market needs to continue creating higher reactionary lows and break above key resistance levels, with $78.44 being the nearest.
Read the full Oil Technical Analysis report below.
Oil Technical Analysis

Weekly Oil Technical Analysis
The weekly chart reveals that the price of oil established a higher weekly low last week, and this week, the market has traded higher by 2,56% percent. This suggests an attempt to reverse the recent downward trend.
The potential reversal is occurring above a key market structure level, marking the upper end of a base formation established in spring this year. Oil technical analysis suggests that if the oil bulls can push the market decisively above the 50-period moving average (currently at 78.16), there could be further upside potential, signalling a completion of the trend reversal.
Alternatively, if the market fails to sustain buying momentum above the 50-period SMA, we might witness further consolidation or a possible decline to levels below 72.33.

Daily Oil Technical Analysis
The oil market continues to strengthen. Two days ago, the market formed another higher reactionary low at 74.14, indicating that buyers are stepping in during pullbacks after a prolonged decline. Over the past two days, the market has risen by 2.8% and appears poised to challenge the 78.44 resistance level. A break above $78.44 could propel the market towards $80.62.
Alternative scenario
On the flip side, if selling pressure intensifies, the market might retract to $74.14. It's noteworthy that the upper boundary of the bullish trend channel aligns with the market structure level at 80.62, making it a potential target for short-term traders.
Indicator-based technical analysis suggests the market is still in a downtrend, with the 20-period moving average below the 50-period SMA. However, our price action oil technical analysis indicates a potential trend reversal. A decisive break above 78.44 would confirm the downtrend's reversal, potentially initiating a new upward trend.

Oil Technical Analysis, 4h
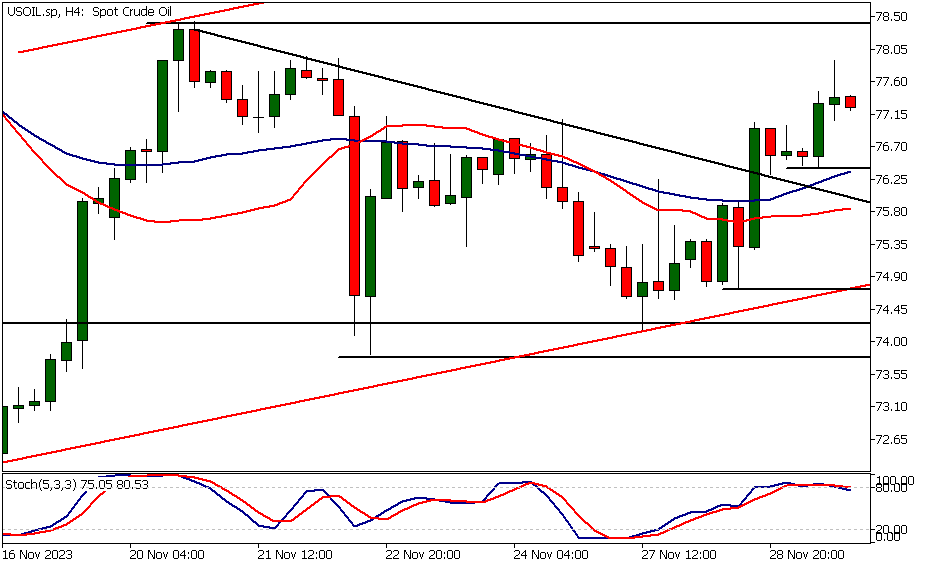
Intraday charts show oil breaking out of a triangle formation, resulting in a higher reactionary low at 76.44. If this level fails to attract buyers, the market may retest the next key support level at 74.72, coinciding with the ascending trend channel's lower boundary.
The most recent complete 4-hour candle is a bearish rejection candle, suggesting a lack of demand at current prices, which could lead to a downward move as the market seeks firmer bids.
OPEC+ meeting
Overall, our oil technical analysis indicates that the oil market is turning bullish and could attract additional buying. However, the outcome of OPEC+ negotiations could significantly impact oil prices. Therefore, it's prudent to keep abreast of news related to the meeting and monitor the market's response to these developments.

Client sentiment analysis
TIOmarkets' clientele are mildly bullish on USOIL, with 66% of clients holding long positions and only 34% shorting the market.
Please remember that the retail trader client sentiment is a contrarian indicator as most of the retail traders are on average betting against the market trends. This is why, experienced traders tend to trade against the retail client sentiment. You can follow the TIOmarkets client sentiment live on our Forex dashboard.
The next key risk events impacting this market
- US Core PCE Price Index m/m
- US Unemployment Claims
- US Chicago PMI
- US Pending Home Sales
- US ISM Manufacturing PMI
- US ISM Manufacturing Prices
- US Fed Chair Powell Speaks

Potential Oil Market Moves
A break above $78.44 could propel the market towards $80.62. On the flip side, if selling pressure intensifies, the market might retract to $74.14. It's noteworthy that the upper boundary of the bullish trend channel aligns with the market structure level at 80.62, making it a potential target for short-term traders.
How would you trade the Oil today?
I hope this Oil technical analysis helps you to make better informed trading decisions. Check the latest market analysis for other instruments and subscribe to receive them in your inbox as soon as they are published
While research has been undertaken to compile the above content, it remains an informational and educational piece only. None of the content provided constitutes any form of investment advice.
TIO Markets UK Limited is a company registered in England and Wales under company number 06592025 and is authorised and regulated by the Financial Conduct Authority FRN: 488900
Risk warning: CFDs are complex instruments and come with a high risk of losing money rapidly due to leverage. 73% of retail investor accounts lose money when trading CFDs with this provider. You should consider whether you understand how CFDs work and whether you can afford to take the high risk of losing your money. Professional clients can lose more than they deposit. All trading involves risk.
DISCLAIMER: TIO Markets offers an exclusively execution-only service. The views expressed are for information purposes only. None of the content provided constitutes any form of investment advice. The comments are made available purely for educational and marketing purposes and do NOT constitute advice or investment recommendation (and should not be considered as such) and do not in any way constitute an invitation to acquire any financial instrument or product. TIOmarkets and its affiliates and consultants are not liable for any damages that may be caused by individual comments or statements by TIOmarkets analysis and assumes no liability with respect to the completeness and correctness of the content presented. The investor is solely responsible for the risk of his/her investment decisions. The analyses and comments presented do not include any consideration of your personal investment objectives, financial circumstances, or needs. The content has not been prepared in accordance with any legal requirements for financial analysis and must, therefore, be viewed by the reader as marketing information. TIOmarkets prohibits duplication or publication without explicit approval.

Janne Muta holds an M.Sc in finance and has over 20 years experience in analysing and trading the financial markets.
