Risk disclaimer: 76% of retail investor accounts lose money when trading CFDs and Spreadbets with this provider. You should consider whether you understand how CFDs and Spreadbets work and whether you can afford to take the high risk of losing your money.
Oil Technical Analysis | Bullish or bearish trajectory?
BY Janne Muta
|December 15, 2023Oil Technical Analysis
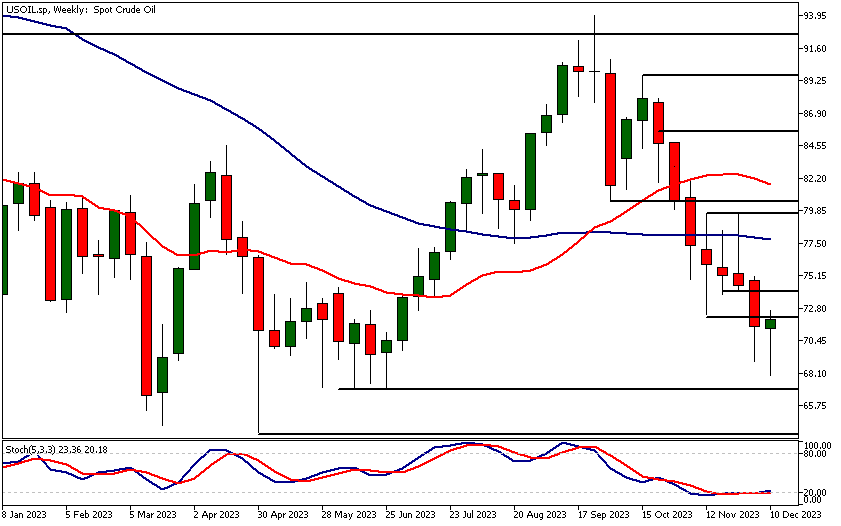
Weekly Oil Technical Analysis
The crude oil market has gained momentum this week after a decline from its September high. If the market closes above $71.38, its opening level this week, it would form a weekly bullish rejection candle. This pattern suggests institutional buying and could potentially lead to market rallying higher. The nearest weekly support level is at $67.12.
Currently, the market is trading at a weekly low of $72.33, a level last seen four weeks ago. If this resistance level is breached, the market could likely move towards $73.80. However, as the market is in a long-term sideways range, the moving average-based oil technical analysis presents mixed signals on the weekly chart.
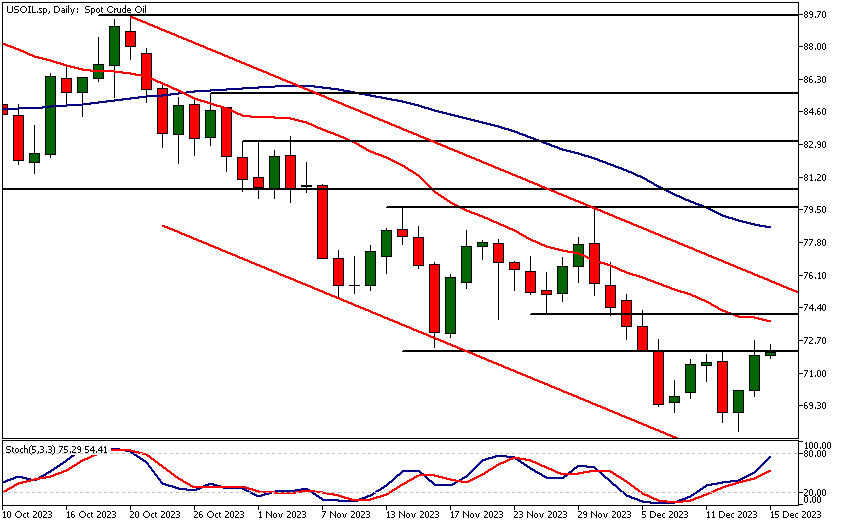
Daily Oil Technical Analysis
The daily chart shows that the market has tested the $72.33 low once and has now returned to this resistance level. If the market rallies above this level, the next key resistance at $74.14 could be tested. This level roughly aligns with the 20-period moving average which adds to the significance of this resistance level.
The moving averages are trending lower, with the 20-period moving average below the 50-period SMA, indicating bearishness according to the indicator-based oil technical analysis. The stochastic oscillator is nearing the overbought zone.
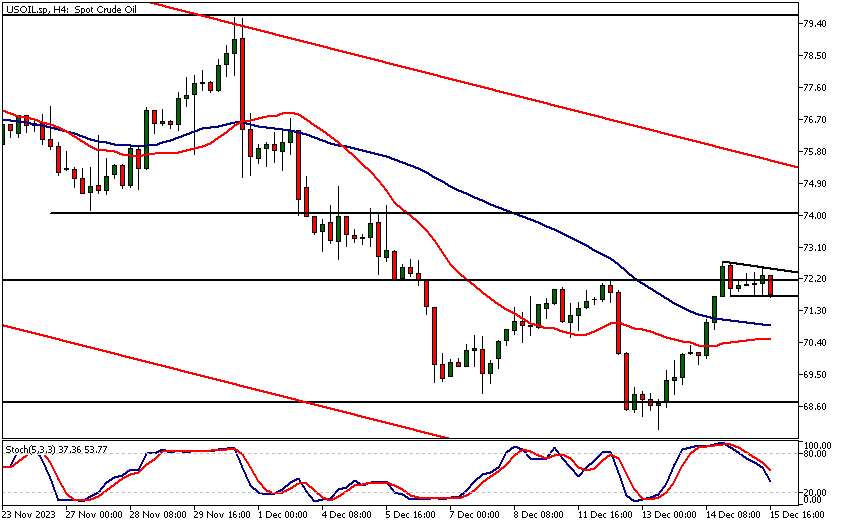
Intraday Oil Technical Analysis
The 8h chart shows how the SMA(20) acted as resistance, and the latest contra-trend rally failed. If the market were able to rally above the SMA(20) and the nearest key resistance level (72.33), the 73.82 level could come into play. The SMA(50) creates a technical confluence at this level.
The slower moving average points down with the faster SMA below it, providing an indication that the bearish trend is strong. Even though the Stochastic Oscillator is in the oversold area, oil technical analysis indicates that the bearish bias remains strong, thus nullifying the oscillator indication.
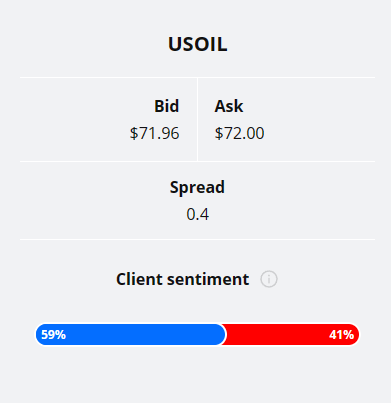
Client sentiment analysis
59% of clients trading USOIL are holding long positions, while 41% are holding short positions. Client sentiment data is being provided by TIO Markets Ltd.
Please remember that the retail trader client sentiment is a contrarian indicator as most of the retail traders are on average betting against the market trends. This is why, experienced traders tend to trade against the retail client sentiment. You can follow the TIOmarkets client sentiment live on our Forex dashboard.
The next key risk events impacting this market
- USD - Flash Manufacturing PMI
- USD - Flash Services PMI
- USD - Building Permits
- USD - CB Consumer Confidence
- USD - Crude Oil Inventories
- USD - Final GDP q/q
- USD - Final GDP Price Index q/q
- USD - Philly Fed Manufacturing Index
Potential Oil Market Moves
In a bullish scenario, overcoming the $74.14 resistance could propel the market towards $76. Conversely, a bearish turn might see a decline to around $69.50 if the current flag pattern resolves downward, with key indicators like moving averages and the stochastic oscillator providing critical insights.

How Would You Trade Oil Today?
I hope this Oil technical analysis helps you to make better informed trading decisions. Check the latest market analysis for other instruments and subscribe to receive them in your inbox as soon as they are published
While research has been undertaken to compile the above content, it remains an informational and educational piece only. None of the content provided constitutes any form of investment advice.
TIO Markets UK Limited is a company registered in England and Wales under company number 06592025 and is authorised and regulated by the Financial Conduct Authority FRN: 488900
Risk warning: CFDs are complex instruments and come with a high risk of losing money rapidly due to leverage. 73% of retail investor accounts lose money when trading CFDs with this provider. You should consider whether you understand how CFDs work and whether you can afford to take the high risk of losing your money. Professional clients can lose more than they deposit. All trading involves risk.
DISCLAIMER: TIO Markets offers an exclusively execution-only service. The views expressed are for information purposes only. None of the content provided constitutes any form of investment advice. The comments are made available purely for educational and marketing purposes and do NOT constitute advice or investment recommendation (and should not be considered as such) and do not in any way constitute an invitation to acquire any financial instrument or product. TIOmarkets and its affiliates and consultants are not liable for any damages that may be caused by individual comments or statements by TIOmarkets analysis and assumes no liability with respect to the completeness and correctness of the content presented. The investor is solely responsible for the risk of his/her investment decisions. The analyses and comments presented do not include any consideration of your personal investment objectives, financial circumstances, or needs. The content has not been prepared in accordance with any legal requirements for financial analysis and must, therefore, be viewed by the reader as marketing information. TIOmarkets prohibits duplication or publication without explicit approval.

Janne Muta holds an M.Sc in finance and has over 20 years experience in analysing and trading the financial markets.
