Risk disclaimer: 76% of retail investor accounts lose money when trading CFDs and Spreadbets with this provider. You should consider whether you understand how CFDs and Spreadbets work and whether you can afford to take the high risk of losing your money.
NZDUSD Analysis | Improving Risk Sentiment Supports NZDUSD
BY Janne Muta
|October 27, 2023NZD Analysis - The US 10 yr. yields moved lower yesterday pressuring the dollar and supporting the major counterparts of the USD. USD lost ground almost across the board weakening only against the CAD. The commodity currencies NZD and AUD moved higher suggesting the market sentiment could be improving.
NZDUSD has faced a downward trend since March, with the USD pressuring the New Zealand dollar, causing the rallies to fail. However, yesterday the NZD strengthened against the USD, leading to a bullish hammer candle formation in NZDUSD.
Summary of this NZDUSD analysis report
- The NZDUSD has been on a downtrend since March, primarily pressured by a strengthening USD.
- On a weekly timeframe, a significant support level established in October 2022 stands at 0.5810, aligning with the bear channel low.
- Recent daily data shows a bullish candle formation in NZDUSD, indicating a potential easing of selling pressure.
- The drop in the US 10 yr. yields pressured the USD against the NZD yesterday.
- The stochastic oscillator's bullish crossover on the daily timeframe suggests a loss of downside momentum in NZDUSD.
Read our full NZDUSD analysis report below.
NZDUSD Analysis
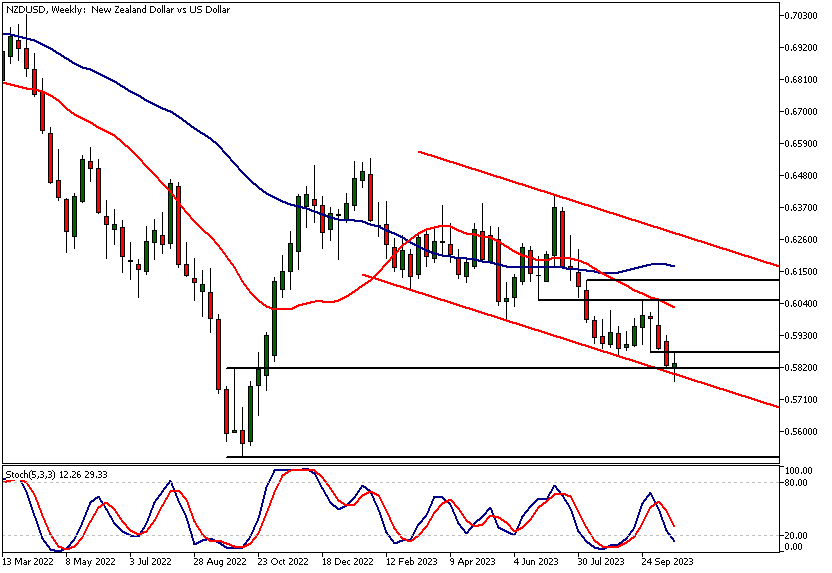
NZDUSD Analysis, Weekly
The NZDUSD currency pair has been trending lower since March this year. USD strength has pressured the New Zealand dollar and the rallies have failed. This week the market has been trading sideways above a market structure level (0.5810) created in October 2022.
This level roughly coincides with the bear channel low, providing it with more significance in NZDUSD analysis. At the same time, the stochastic oscillator is oversold at the current value of 10.21.
Key Resistance and Market Moves
The nearest key resistance level is relatively close by at 0.5871. Unless the market can rally decisively above this level, it is likely to remain under pressure and could break down to 0.5743. Above 0.5871, look for a move to 0.5973 or so.

NZDUSD Analysis, Daily
Yesterday, the New Zealand dollar strengthened against the US dollar. The upward move created a bullish candle in NZDUSD with a long wick below the candle body. This bullish candle formation suggests that the selling pressure has eased and buyers have stepped into the market.
Stochastic Oscillator's Bullish Move
The stochastic oscillator has given a bullish crossover and is moving higher. If the market can close decisively above yesterday's high at 0.5830, the market could rally further and move to 0.5870. A failure to do so could push the market down to 0.5780.
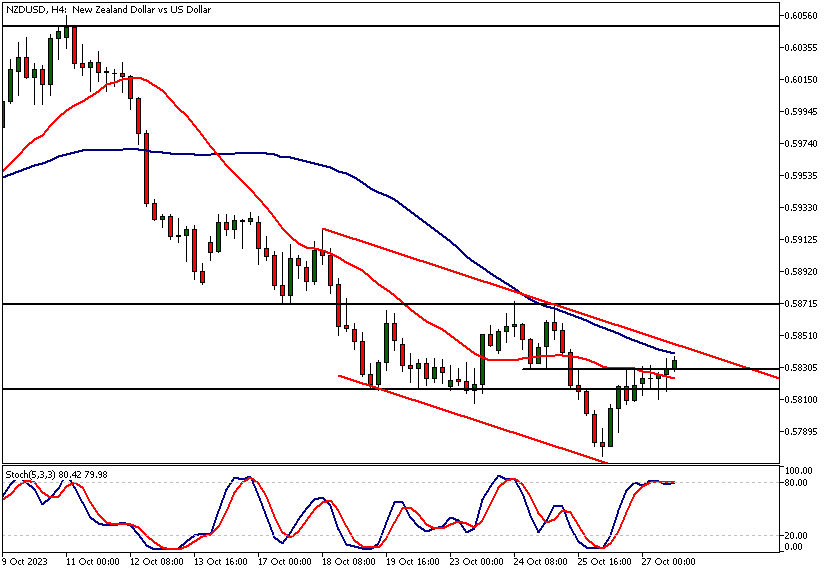
NZDUSD Analysis, 4h
The 4-hour chart shows the market trading inside a bearish trend channel. At the time of writing, the market is struggling to penetrate a 4h market structure level at 0.5830. This level is yesterday's high, which we referred to in the daily NZDUSD analysis section.
Sloping Resistance Area
The 4-hour chart also reveals how the market is edging closer to the upper end of the bearish trend channel. The 50-period moving average is closely aligned with the channel top, creating a sloping resistance area above the current market price. The stochastic oscillator could be giving a sell signal after being in the overbought territory.
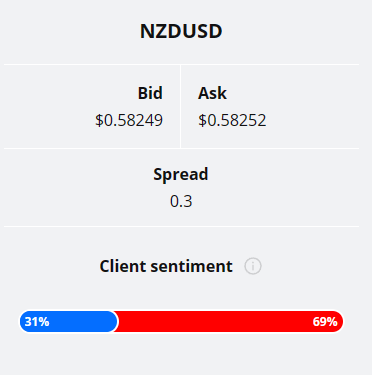
Client sentiment analysis
TIOmarkets clients are mostly bearish on NZDUSD with 69% of clients holding short positions and 31% holding long positions in the market.
Please remember that the retail trader client sentiment is a contrarian indicator as most of the retail traders are on average betting against the market trends. This is why, experienced traders tend to trade against the retail client sentiment. You can follow the TIOmarkets client sentiment live on our Forex dashboard.
The Next Key Risk Events
- US Revised UoM Consumer Sentiment
- USD Employment Cost Index
- Chicago PMI
- US CB Consumer Confidence
- New Zealand's Employment Change
Potential NZDUSD market moves
The NZDUSD pair finds robust support, driving prices higher. Renewed buying interest and positive economic indicators push the currency above 0.5871 signaling a potential upward trend.
Negative data releases and geopolitical tensions could weigh down the currency, pushing the market back to 0.5773.
How would you trade NZDUSD today?
I hope this fundamental and technical analysis of NZDUSD helps you make better informed trading decisions. Check the latest market analysis for other instruments and subscribe to receive them in your inbox as soon as they are published
While research has been undertaken to compile the above content, it remains an informational and educational piece only. None of the content provided constitutes any form of investment advice.
Tio Markets UK Limited is a company registered in England and Wales under company number 06592025 and is authorised and regulated by the Financial Conduct Authority FRN: 488900
Risk warning: CFDs are complex instruments and come with a high risk of losing money rapidly due to leverage. 82% of retail investor accounts lose money when trading CFDs with this provider. You should consider whether you understand how CFDs work and whether you can afford to take the high risk of losing your money. Professional clients can lose more than they deposit. All trading involves risk.
DISCLAIMER: Tio Markets offers an exclusively execution-only service. The views expressed are for information purposes only. None of the content provided constitutes any form of investment advice. The comments are made available purely for educational and marketing purposes and do NOT constitute advice or investment recommendation (and should not be considered as such) and do not in any way constitute an invitation to acquire any financial instrument or product. TIOmarkets and its affiliates and consultants are not liable for any damages that may be caused by individual comments or statements by TIOmarkets analysis and assumes no liability with respect to the completeness and correctness of the content presented. The investor is solely responsible for the risk of his/her investment decisions. The analyses and comments presented do not include any consideration of your personal investment objectives, financial circumstances, or needs. The content has not been prepared in accordance with any legal requirements for financial analysis and must, therefore, be viewed by the reader as marketing information. TIOmarkets prohibits duplication or publication without explicit approval.

Janne Muta holds an M.Sc in finance and has over 20 years experience in analysing and trading the financial markets.
